- Home
- IIBA
- Cetified business analysis professional (CBAP) appliaction
- IIBA.CBAP.v2024-08-01.q239
- Question 125
Valid CBAP Dumps shared by ExamDiscuss.com for Helping Passing CBAP Exam! ExamDiscuss.com now offer the newest CBAP exam dumps, the ExamDiscuss.com CBAP exam questions have been updated and answers have been corrected get the newest ExamDiscuss.com CBAP dumps with Test Engine here:
Access CBAP Dumps Premium Version
(499 Q&As Dumps, 35%OFF Special Discount Code: freecram)
<< Prev Question Next Question >>
Question 125/239
An insurance company wants to increase sales by 15% and customer retention by 10% within 1 calendar year.
Various strategies to achieve this were considered and a restructure to the existing pricing model is selected to help achieve these goals.
A business analyst (BA) works with stakeholders such as actuaries, product specialists, sales staff, risk managers, and underwriters who agree to applying varying levels of discounts to customers based on:
*Total annual premium the customer has with the company (Financial worth)
*Time with the insurance company (Loyalty)
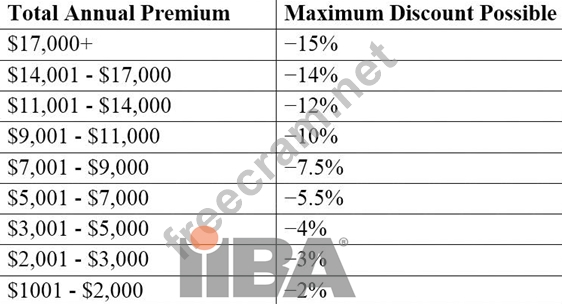
Various financial models are considered but the stakeholders agree that an initial applicable discount is determined based on the customer's overall premium:
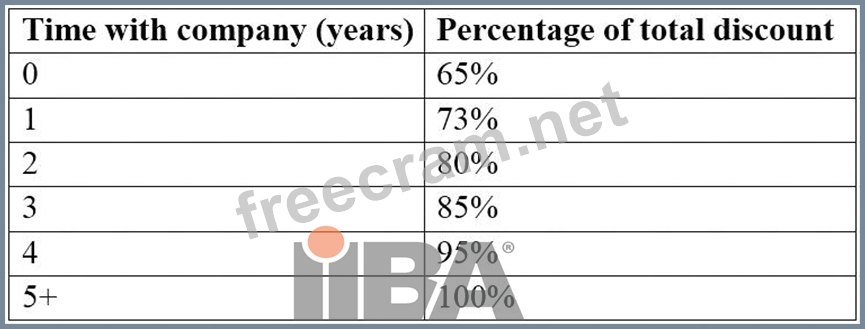
The percentage of the maximum possible discount available to the customer is adjusted based on time with the company:
What did the BA create to ensure that everyone who needed to be included had been?
Various strategies to achieve this were considered and a restructure to the existing pricing model is selected to help achieve these goals.
A business analyst (BA) works with stakeholders such as actuaries, product specialists, sales staff, risk managers, and underwriters who agree to applying varying levels of discounts to customers based on:
*Total annual premium the customer has with the company (Financial worth)
*Time with the insurance company (Loyalty)
Various financial models are considered but the stakeholders agree that an initial applicable discount is determined based on the customer's overall premium:
The percentage of the maximum possible discount available to the customer is adjusted based on time with the company:
What did the BA create to ensure that everyone who needed to be included had been?
Correct Answer: A
Explanation
An onion diagram is a technique that helps to identify and analyze the stakeholders involved in a project or a solution. It consists of a series of concentric circles that represent different levels of stakeholder influence and interest. The innermost circle contains the core stakeholders who have the highest influence and interest, such as the project team and the sponsor. The outermost circle contains the peripheral stakeholders who have the lowest influence and interest, such as the regulators and the competitors. The circles in between contain the primary and secondary stakeholders who have varying degrees of influence and interest, such as the customers, the suppliers, the partners, etc. An onion diagram helps to ensure that everyone who needed to be included has been considered and engaged appropriately.
References:
[BABOK Guide v3], Section 2.2: Identify Stakeholders, p. 16-17
CBAP / CCBA Certified Business Analysis Study Guide, 2nd Edition, Chapter 2: Business Analysis Planning and Monitoring, p. 48-49 Certified Business Analysis Professional (CBAP) Specialization, Course 1: Business Analysis:
Planning and Monitoring, Week 2: Plan Business Analysis Governance, Video: Stakeholder Identification Techniques Onion Diagram - Stakeholder Mapping, Blog Post, June 2018


- Question List (239q)
- Question 1: You are working with several business analysts to determine ...
- Question 2: A business analyst (BA) is assessing tie different solution ...
- Question 3: Which of the following is a table of all stakeholders showin...
- Question 4: You are the business analyst for a smaller project where the...
- Question 5: You are the business analyst for a large project that will c...
- Question 6: A business analyst (BA) plans to hold a workshop next week t...
- Question 7: Due to the complexity of a project the project board a conce...
- Question 8: The technology team at a financial institution has successfu...
- Question 9: There are four inputs to writing the business case as part o...
- Question 10: A corporation is experiencing poor financial performance and...
- Question 11: A utility company found mat its current billing system charg...
- Question 12: Holly is the business analyst for her organization. Holly en...
- Question 13: Which of the following requirement attributes lacks any ambi...
- Question 14: Which of the following defines how the project will be estim...
- Question 15: A business analyst (BA) is in the process of allocating requ...
- Question 16: Whilst working on business requirements to improve a process...
- Question 17: What business analysis element tries to identify as many pot...
- Question 18: You are the business analyst for your organization. Manageme...
- Question 19: A company with a big information technology (lT) department ...
- Question 20: You are creating the solution scope for a proposed solution ...
- Question 21: You are the business analyst for your organization and are i...
- Question 22: Which of the following is mandatory in most software develop...
- Question 23: Which of the following diagrams is known as Ishikawa diagram...
- Question 24: Robert is the business analyst for his organization and he's...
- Question 25: You are currently working on creating the activity list for ...
- Question 26: An online stock trading system is under implementation. Whic...
- Question 27: In performing the task of planning for business analysis gov...
- Question 28: You are the business analyst for your organization and are c...
- Question 29: Ned is the business analyst for the NHQ Company. He is worki...
- Question 30: In a risk assessment exercise of a software implementation p...
- Question 31: Company A is a nation-wide leader in commercial demolition. ...
- Question 32: The project manager wants to have the requirements analysis ...
- Question 33: Before investing further in the project, a customer and the ...
- Question 34: Which of the following terms is used to describe a major del...
- Question 35: You are the business analyst for your organization. On your ...
- Question 36: It's often impossible or difficult to prove that the impleme...
- Question 37: A financial institution engaged in mortgage lending has emba...
- Question 38: A business analyst (BA) is preparing to specify requirements...
- Question 39: You are the business analyst for a large project in your org...
- Question 40: A busmen analyst (BA) is assigned a new project to improve a...
- Question 41: Which of the following directs the improvement efforts to th...
- Question 42: Which of the following represents the duration of activities...
- Question 43: A business analyst (BA) is running a workshop with a group o...
- Question 44: A solution implemented three months ago has decreased perfor...
- Question 45: A business analyst (BA) is preparing for observation. A pass...
- Question 46: A business analyst (BA) has been assigned to manage the ongo...
- Question 47: While validating requirements for a software implementation ...
- Question 48: Which of the following models demonstrates the attributes, o...
- Question 49: Ben is the business analyst for his organization. Ben is cur...
- Question 50: A team of business analysts (BAs) were assigned to review an...
- Question 51: A major manufacturer of popular beverages has appointed a lo...
- Question 52: You are the business analyst for your organization and you a...
- Question 53: You are the business analyst for a new project. Part of this...
- Question 54: A health insurance provider undertakes enhancements to its m...
- Question 55: There are 50 stakeholders in the current project. How many c...
- Question 56: A business analyst (BA) finds that the solution service leve...
- Question 57: A business analyst (BA) is working on a payment system (PS) ...
- Question 58: You are the business analyst for your organization. Gary and...
- Question 59: A business analyst (BA) working on a recently implemented pr...
- Question 60: You are the business analyst for a large project in your org...
- Question 61: A software development company is in the process of creating...
- Question 62: Which of the following is NOT a component of flowchart?...
- Question 63: A popular department store chain wants to make computer upgr...
- Question 64: Which of the following techniques is used to divide a projec...
- Question 65: What technique used during the manage business analysis perf...
- Question 66: A business unit of a transnational manufacturer wants to imp...
- Question 67: A financial institution engaged in mortgage lending has emba...
- Question 68: While reviewing a subset of requirements with stakeholders, ...
- Question 69: You are completing enterprise analysis. Management has asked...
- Question 70: An insurance company wants to increase sales by 15% and cust...
- Question 71: A business analyst (BA) working on a recently implemented pr...
- Question 72: You are the business analyst for your organization. You are ...
- Question 73: Company A has been engaged to provided solution software to ...
- Question 74: What is the purpose of the business case?...
- Question 75: A very large insurer of General Liability and Property Damag...
- Question 76: Most users of a pilot application have experienced more effi...
- Question 77: Which of the following is the process of analyzing the areas...
- Question 78: A popular department store chain wants to make computer upgr...
- Question 79: Enterprise analysis provides many things for an organization...
- Question 80: Gary is the business analyst for his organization and he is ...
- Question 81: Which of the following techniques involves coordinating and ...
- Question 82: Which of the following processes is used to make certain tha...
- Question 83: A software development company is in the process of creating...
- Question 84: Martha is observing Gary complete several activities as part...
- Question 85: A national branch of a global company is struggling to impro...
- Question 86: Henry is the business analyst for the UUH Organization. Curr...
- Question 87: Which of the following process models needs to complete each...
- Question 88: A business analyst (BA) has recently completed a comprehensi...
- Question 89: You are working with Terry on the conduct stakeholder analys...
- Question 90: Marcy is the business analyst for her organization. She is c...
- Question 91: When determining the success criteria for an initiative a bu...
- Question 92: A company with a big information technology (IT) department ...
- Question 93: Your organization uses the MoSCoW approach to requirements p...
- Question 94: Which of the following requires that all parties in the conf...
- Question 95: A company wants to develop a product roadmap to guide future...
- Question 96: You are the business analyst for your organization. As part ...
- Question 97: Which of the following is the best definition of the busines...
- Question 98: A company with a big information technology (IT) department ...
- Question 99: A business analyst (BA) works for a financial institution th...
- Question 100: A new project has to implement a cyber security release in C...
- Question 101: After determining mat the enterprise culture was the driving...
- Question 102: Which stakeholder must approve the business analysis approac...
- Question 103: A team is working on a user privilege and access control sys...
- Question 104: Which of the following documents is described in the stateme...
- Question 105: You are the business analyst for your organization. You want...
- Question 106: You have completed the requirements documentation and the st...
- Question 107: A leading software manufacturing company has appointed a bus...
- Question 108: A company is about to embark upon a large organizational cha...
- Question 109: A floral company wants to gather information about each of i...
- Question 110: A business analyst (BA) has been given a defect during user ...
- Question 111: You are the business analyst for your organization and are p...
- Question 112: Which of the following captures all of the activities within...
- Question 113: In a software implementation project, the designated busines...
- Question 114: Which of the following is the comparison of planned project ...
- Question 115: After the new report "Customer Sales by Date" was deployed l...
- Question 116: Paul is the business analyst for his organization. He is exa...
- Question 117: Which of the following authorizes the project to exist withi...
- Question 118: Gary is the business analyst for his organization. He has re...
- Question 119: A business analyst (BA) assigned to a project has been asked...
- Question 120: The business analysis approach generally defines all of the ...
- Question 121: Which of the following inputs of Monitor and Control Risks a...
- Question 122: A business analyst (BA) has engaged various groups from acro...
- Question 123: Whatare timeless events that show progress in the project. T...
- Question 124: Mark is the business analyst for his organization. He is wor...
- Question 125: An insurance company wants to increase sales by 15% and cust...
- Question 126: You are the business analyst for the YGT Organization. You h...
- Question 127: Which of the following techniques is used to test customer a...
- Question 128: You are the business analyst for your organization and are p...
- Question 129: Bob and Susan are business analysts for their organization. ...
- Question 130: As part of identifying an enterprise's capability to adopt a...
- Question 131: Holly's organization uses a plan-driven approach to business...
- Question 132: You are the business analyst for the NHQ Organization. Manag...
- Question 133: You and Tom are writing the solution scope for a new project...
- Question 134: You are the business analyst for your organization and are t...
- Question 135: A major manufacturer of popular beverages has appointed a lo...
- Question 136: You are the business analyst for your organization and are b...
- Question 137: Which of the following is a procurement document?...
- Question 138: Donna is leading a brainstorming session for her organizatio...
- Question 139: You are the business analyst for your organization and are p...
- Question 140: Rachel is writing the business case for her organization. As...
- Question 141: A business unit of a transnational manufacturer wants to imp...
- Question 142: A business unit of a transnational manufacturer wants to imp...
- Question 143: All of the following are examples of transference risk respo...
- Question 144: Jenni is the business analyst for the UHQ Organization. She ...
- Question 145: Enterprise analysis creates just five outputs. Which one of ...
- Question 146: What does the T in SWOT analysis mean?...
- Question 147: A business analyst (BA) is preparing a governance approach. ...
- Question 148: A business analyst (BA) is working on a payment system (PS) ...
- Question 149: A major manufacturer of popular beverages has appointed a lo...
- Question 150: Which of the following can be an effective tool during quali...
- Question 151: Which of the following processes is used by organizations to...
- Question 152: A business analyst (BA) is outlining who should participate ...
- Question 153: You are the business analyst for your organization and worki...
- Question 154: Which of the following roles approves the project scope stat...
- Question 155: You are completing the requirements for vendor selection and...
- Question 156: The business analyst (BA) has been tasked with assessing and...
- Question 157: Before investing further in the project, a customer and the ...
- Question 158: A business analyst (BA) has a meeting next week with the pro...
- Question 159: Which of the following is a narrative description of the wor...
- Question 160: As part of the requirements analysis a business analyst can ...
- Question 161: What business analysis process ensures that requirements spe...
- Question 162: A large insurance company wants to buy a new claims processi...
- Question 163: You are the business analyst for your organization. You are ...
- Question 164: Which of the following document is created first after proje...
- Question 165: Which of the following diagrams is used to display sensitivi...
- Question 166: A health insurance provider undertakes enhancements to its m...
- Question 167: What type of requirements elicitation technique is the Delph...
- Question 168: You are creating the solution scope for an identified proble...
- Question 169: A popular department store chain wants to make computer upgr...
- Question 170: A business analyst is helping management determine which sol...
- Question 171: An organization implements a solution to increase the effici...
- Question 172: The business analyst (BA) is preparing to determine the impa...
- Question 173: A multi-domain project has stakeholders with different techn...
- Question 174: Zoe is the business analyst for her organization. She is cur...
- Question 175: A company finalized the implementation of a new, corporate-w...
- Question 176: Which of the following is a flowchart that shows all the pro...
- Question 177: Company A is a nation-wide leader in commercial demolition. ...
- Question 178: The creative thinking process has three values to determine ...
- Question 179: You are the business analyst for your organization. For the ...
- Question 180: You are the business analyst for the NHQ Project. You have i...
- Question 181: Management would like you to front-load the requirements wit...
- Question 182: The seminar administrator reviewed these three diagrams and ...
- Question 183: The stakeholder of a new product that is in early adaptive d...
- Question 184: Herb is the business analyst for the HYY Organization. As He...
- Question 185: You are the business analyst for your organization. Manageme...
- Question 186: You are the business analyst for your organization and are c...
- Question 187: A business analyst (BA) is working on an initiative to decom...
- Question 188: A non-profit utility company has 900 employees, a majority o...
- Question 189: Contracts are currently managed by more than 20 contract own...
- Question 190: A business analyst (BA) facilitated elicitation activities w...
- Question 191: All of the following are techniques that can be used to spec...
- Question 192: You are the business analyst for your organization and are w...
- Question 193: Which of the following describes the actual users who intera...
- Question 194: A very large insurer of General Liability and Property Damag...
- Question 195: A customer has provided a business analyst (BA) with many bu...
- Question 196: There are four inputs to the plan business analysis activiti...
- Question 197: The business sponsor of a project to automate a high risk, h...
- Question 198: You are the business analyst for THY Organization and you ha...
- Question 199: You are the business analyst for your organization and are a...
- Question 200: You are the business analyst for your organization and prepa...
- Question 201: A company has a process improvement initiative that is proje...
- Question 202: Which of the following techniques involves determining and d...
- Question 203: A business analyst (BA) is capturing the requirements for an...
- Question 204: Nancy has asked you to trace a particular requirement for he...
- Question 205: Several risks were identified for an upcoming change initiat...
- Question 206: Which of the following stages of a project defines the numbe...
- Question 207: You are the business analyst for your organization and you a...
- Question 208: You are the business analyst for your organization and are t...
- Question 209: You are the business analyst for your organization and you a...
- Question 210: Which of the following displays the relative importance of t...
- Question 211: You are the business analyst for your organization and are t...
- Question 212: You need to identify assumptions as part of the assessment o...
- Question 213: Which one of the following diagrams when properly laid out i...
- Question 214: Paul has been asked to complete SWOT analysis for his soluti...
- Question 215: You are coaching Marcy, a new business analyst for your orga...
- Question 216: Which of the following participants have to keep the minutes...
- Question 217: You are the business analyst for the TGH Organization and ar...
- Question 218: (Exhibit) The table illustrate the statement of cash flower ...
- Question 219: Which of the following chart shows the correlation between p...
- Question 220: You are the business analyst for your organization. Manageme...
- Question 221: The objective of a solution implemented was to increase the ...
- Question 222: A business analyst (BA) has defined a business analysis appr...
- Question 223: What element of the conduct elicitation activity is tracked ...
- Question 224: You are the business analyst for your organization and are w...
- Question 225: You are the business analyst for your organization. Manageme...
- Question 226: You are the business analyst for a solution that has 435 sta...
- Question 227: An organization is trying to streamline its current processe...
- Question 228: Which of the following reports is generated whenever the pro...
- Question 229: You are creating a model that shows how data moves through a...
- Question 230: Which of the following tasks cannot start until other tasks ...
- Question 231: The BA is analyzing the requirements that are represented in...
- Question 232: A business analyst (BA) is developing an approach for inform...
- Question 233: A software development company is in the process of creating...
- Question 234: You are the business analyst for a large, complex solution a...
- Question 235: A company wants to launch an existing product in another cha...
- Question 236: Which of the following processes includes tasks and roles, r...
- Question 237: Which of the following can be used in root cause analysis?...
- Question 238: Your organization is using a plan-driven approach to busines...
- Question 239: Which of the following is responsible for preparing the busi...
