Valid TDA-C01 Dumps shared by ExamDiscuss.com for Helping Passing TDA-C01 Exam! ExamDiscuss.com now offer the newest TDA-C01 exam dumps, the ExamDiscuss.com TDA-C01 exam questions have been updated and answers have been corrected get the newest ExamDiscuss.com TDA-C01 dumps with Test Engine here:
Access TDA-C01 Dumps Premium Version
(178 Q&As Dumps, 35%OFF Special Discount Code: freecram)
<< Prev Question Next Question >>
Question 23/49
You have the following chart that shows profits and discounts over time.
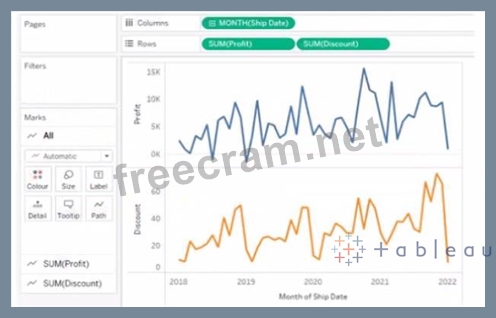
You need to combine the lines to appear as shown in the following chart.
What should you do?
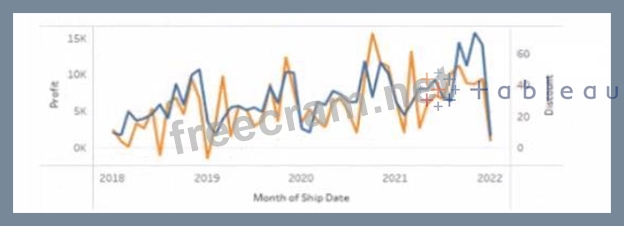
You need to combine the lines to appear as shown in the following chart.
What should you do?
Correct Answer: C
To combine the lines to appear as shown in the second chart, you should set Discount to Dual Axis. Dual Axis is a feature that allows you to show two measures on two separate axes on one chart. You can create a dual axis by right-clicking on a measure on any shelf and selecting Dual Axis from the menu. This will create two axes on one chart and synchronize their scales.
In this case, you want to show Profit and Discount on two separate axes on one chart. You can right-click on Discount on any shelf and select Dual Axis from the menu. This will create a dual axis chart that shows Profit and Discount as two lines with different colors.
The other options are not correct for this scenario. Dragging Discount to Color on the Marks card will change the color of Profit based on Discount, but it will not show two lines. Converting Discount to Discrete will change Discount from a green pill to a blue pill, but it will not affect how it appears on the chart. Dragging Discount to Columns shelf will create two separate charts for Profit and Discount, but it will not combine them. References: https://help.tableau.com/current/pro/desktop/en-us/multiplemeasures.htm
https://help.tableau.com/current/pro/desktop/en-us/multiplemeasures_dualaxes.htm


- Question List (49q)
- Question 1: You have the following table. (Exhibit) You need each record...
- Question 2: You are the owner of an alert. You receive an email notifica...
- Question 3: You have a dataset that contains daily sales by business seg...
- Question 4: You have the following dataset in Microsoft Excel. (Exhibit)...
- Question 5: You want to connect a Tableau workbook to a dataset in a Mic...
- Question 6: You connect to a database server by using Tableau Prep. The ...
- Question 7: You have the following box plot that shows the distribution ...
- Question 8: You create the following worksheet (Exhibit) The Pick Measur...
- Question 9: You have the following dataset (Exhibit) You need to create ...
- Question 10: You are developing a data source in Tableau Prep. You have t...
- Question 11: You want to create the following table in a view. (Exhibit) ...
- Question 12: Open the link to Book1 found on the desktop. Open the Movie ...
- Question 13: You have the following visualization. (Exhibit) You want the...
- Question 14: You have a dashboard that is configured for desktop browsers...
- Question 15: You have the following Map. (Exhibit) You need the map to ap...
- Question 16: You have the following dashboard that contains two sheets. (...
- Question 17: You have the following two datasets: * A Microsoft Excel wor...
- Question 18: You have the following visualization. (Exhibit) You Create a...
- Question 19: Open the link to Book1 found on the desktop. Use the Superst...
- Question 20: You have a dataset that has four fields named Category. Prof...
- Question 21: in which three formats can you export a worksheet from the W...
- Question 22: You have the following visualization. (Exhibit)...
- Question 23: You have the following chart that shows profits and discount...
- Question 24: You have a line chart on a worksheet. You want to add a comm...
- Question 25: You have a Tableau workbook. You want to make the workbook a...
- Question 26: You have a dataset that contains people and the awards they ...
- Question 27: You have a data source that contains data tor every city in ...
- Question 28: You have the following dataset. (Exhibit) You need to create...
- Question 29: You have a Tableau Prep flow that joins a dataset named Glob...
- Question 30: In a dataset, you have a string field named Name that contai...
- Question 31: Open the link to Book1 found on the desktop. Open the Histog...
- Question 32: Open the Link to Book1 found on the desktop. Open Map worksh...
- Question 33: You have the following primary data source that contains a d...
- Question 34: From Tableau Desktop you sign in lo a Tableau Server site. W...
- Question 35: You have the following dataset: (Exhibit) Which grouping opt...
- Question 36: A colleague provides you with access to a folder that contai...
- Question 37: You have two data sources that use the same schema One data ...
- Question 38: You have the following dataset. (Exhibit) When you use the d...
- Question 39: You want to create the following dashboard. (Exhibit) The da...
- Question 40: You have the following dataset. (Exhibit) Which formula calc...
- Question 41: You have the following dataset. (Exhibit) Which grouping opt...
- Question 42: You are creating a new dashboard. You need to add a button t...
- Question 43: You have a dataset that contains sates data. The following i...
- Question 44: You have the following line chart that shows the average sal...
- Question 45: Open the link to Book1 found on the desktop. Open Discipline...
- Question 46: You have the following worksheet. (Exhibit) You want to crea...
- Question 47: You have a blank dashboard. You want to add two sheets to th...
- Question 48: You have the following dataset: (Exhibit) You want to create...
- Question 49: You have the following tiled dashboard that has one sheet. (...
