<< Prev Question Next Question >>
Question 10/49
You are developing a data source in Tableau Prep.
You have two tables named Orders and Employees.
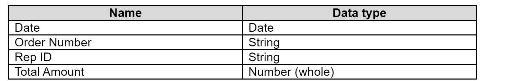
The Orders table was created in 2019 and contains the following columns.
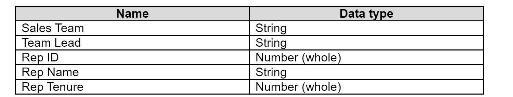
The Employees table contains all the employee information for the various sales teams in the sales department and contains the following columns
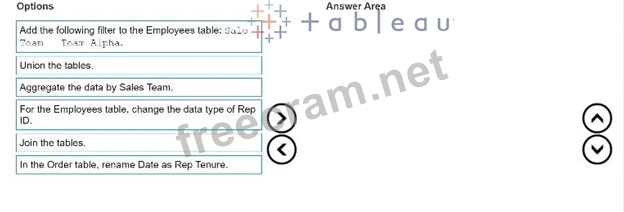
You want to prepare the data so that you can analyze sales trends over time for every sales team.
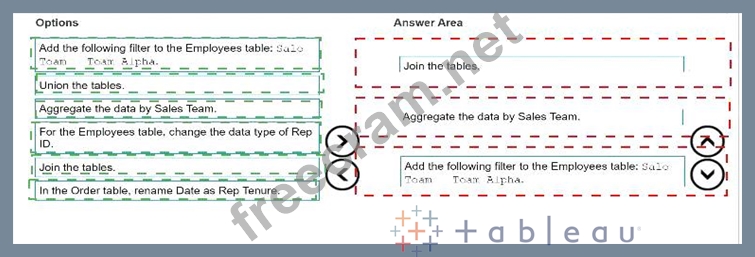
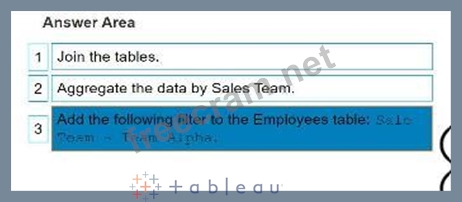
Which three actions should you perform in order? (Place the three correct options in order. Use the arrows to move Options to Answer Area. Use Answer Area arrows to re-order the options.)
You have two tables named Orders and Employees.
The Orders table was created in 2019 and contains the following columns.
The Employees table contains all the employee information for the various sales teams in the sales department and contains the following columns
You want to prepare the data so that you can analyze sales trends over time for every sales team.
Which three actions should you perform in order? (Place the three correct options in order. Use the arrows to move Options to Answer Area. Use Answer Area arrows to re-order the options.)