- Home
- Microsoft
- Microsoft Dynamics 365 Customer Service Functional Consultant
- Microsoft.MB-230.v2024-12-17.q135
- Question 33
Valid MB-230 Dumps shared by ExamDiscuss.com for Helping Passing MB-230 Exam! ExamDiscuss.com now offer the newest MB-230 exam dumps, the ExamDiscuss.com MB-230 exam questions have been updated and answers have been corrected get the newest ExamDiscuss.com MB-230 dumps with Test Engine here:
Access MB-230 Dumps Premium Version
(330 Q&As Dumps, 35%OFF Special Discount Code: freecram)
<< Prev Question Next Question >>
Question 33/135
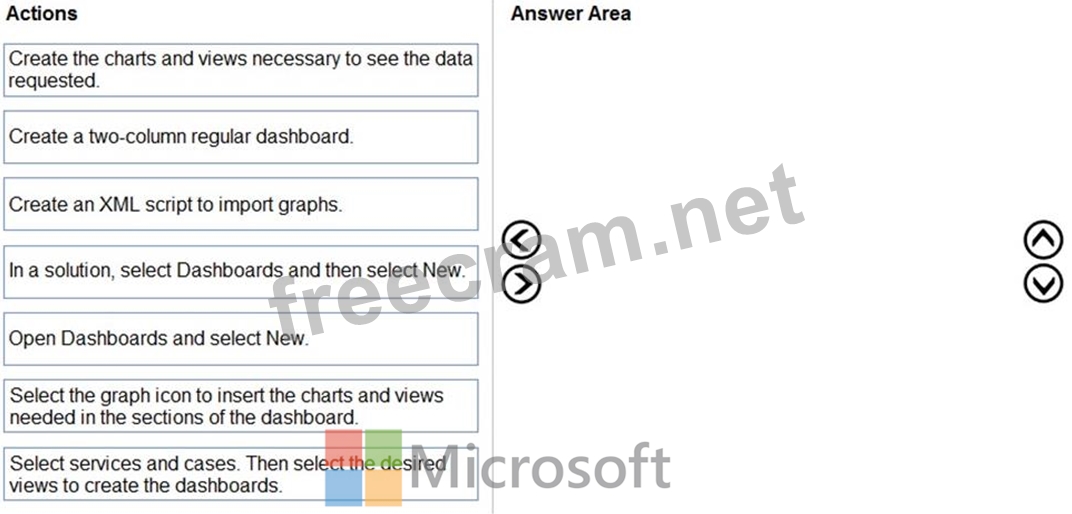
You need to build a personal dashboard that displays the following charts and views:
Charts:
Number of cases by owner and priority
Products with most cases opened
Views:
Display the number of cases opened in a seven-day period
Display the number of escalated cases
Which four actions should you perform in sequence? To answer, move the appropriate actions from the list of actions to the answer area and arrange them in the correct order.
Correct Answer:
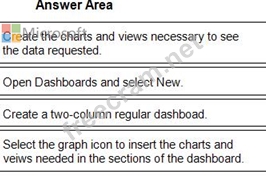
1 - Create the charts and views necessary to see the data requested.
2 - Open Dashboards and select New.
3 - Create a two-column regular dashboad.
4 - Select the graph icon to insert the charts and veiws needed in the sections of the dashboard.
Reference:
https://docs.microsoft.com/en-us/powerapps/user/track-your-progress-with-dashboard-and-charts


- Question List (135q)
- Question 1: You need to create the dashboards. Which dashboard types sho...
- Question 2: You are a Dynamics 365 for Customer Service administrator cr...
- Question 3: Your company uses Dynamics 365 Customer Service. You create ...
- Question 4: You need to configure the queue for telephone-based cases. W...
- Question 5: A company is using Omnichannel for Customer Service. You add...
- Question 6: Note: This question is part of a series of questions that pr...
- Question 7: You are a Dynamics 365 Customer Service administrator. You a...
- Question 8: You are a Dynamics 365 Customer Service administrator. You m...
- Question 9: You are an Omnichannel supervisor for a company. The manager...
- Question 10: Note: This question is part of a series of questions that pr...
- Question 11: You are an Omnichannel supervisor at a company. You install ...
- Question 12: You need to configure the options for the schedule. Which op...
- Question 13: You are creating a Power Virtual Agents chatbot to handle co...
- Question 14: A company implements Dynamics 365 for Customer Service. Whic...
- Question 15: You are a customer service manager for a company using Dynam...
- Question 16: You are using Dynamics 365 Customer Service. You are viewing...
- Question 17: You are a Dynamics 365 Customer Service administrator. You n...
- Question 18: You send surveys to customers who have opened cases within t...
- Question 19: A company uses Dynamics 365 Customer Service. The schedule s...
- Question 20: You are a Dynamics 365 Customer Service administrator. You c...
- Question 21: You ate creating agent scripts in Dynamics 365 Customer Serv...
- Question 22: A company uses Customer Service. The company plans to enable...
- Question 23: A company is implementing Omnichannel for Customer Service. ...
- Question 24: You work for a power company that uses Dynamics 365 Customer...
- Question 25: You are a system administrator for Dynamics 365 for Customer...
- Question 26: Note: This question is part of a series of questions that pr...
- Question 27: You need to select the feature for each parameter. Which fea...
- Question 28: A company uses Dynamics 365 Customer Service. The manufactur...
- Question 29: You need to configure the settings to handle customer claims...
- Question 30: You are implementing Omnichannel for Customer Service for a ...
- Question 31: A company installs and services air filtration units for ind...
- Question 32: A company needs to publish knowledge base ankles. You need t...
- Question 33: You need to build a personal dashboard that displays the fol...
- Question 34: A company uses Dynamics 365 Customer Sen/ice. Agents note th...
- Question 35: You are customizing a Dynamics 36S Customer Service implemen...
- Question 36: You are implementing Omnichannel for Customer Service for a ...
- Question 37: A Dynamics 365 Customer Service organization uses routing ru...
- Question 38: You need to choose which tools need to be created and config...
- Question 39: Note: This question is part of a series of questions that pr...
- Question 40: A company uses Dynamics 365 Customer Service. The company in...
- Question 41: You need to assign the minimum required security roles to a ...
- Question 42: A company is implementing Dynamics 365 Customer Service. The...
- Question 43: A company has a Customer Service deployment. The company pla...
- Question 44: You are implementing Dynamics 365 Customer Service Workspace...
- Question 45: You are implementing Dynamics 365 for Customer Service. You ...
- Question 46: You are customizing an Omnichannel for Customer Service impl...
- Question 47: You need to select the steps to create a new macro that will...
- Question 48: You need to set up the system for cases going to supervisors...
- Question 49: You need to configure OmniChannel to route correctly. Which ...
- Question 50: You ate creating agent scripts that have macros for quick st...
- Question 51: You are a Dynamics 365 for Customer Service administrator. T...
- Question 52: You are implementing Omnichannel for Customer Service for a ...
- Question 53: A company closes the business each year for nine business da...
- Question 54: Note: This question is part of a series of questions that pr...
- Question 55: A company has a Customer Service deployment. The company pla...
- Question 56: You need to add SLA timers to the Case form. Which two optio...
- Question 57: A company implements Dynamics 365 Customer Voice. When the c...
- Question 58: You implement Dynamics 365 Customer Service for a call cente...
- Question 59: You need to choose the appropriate actions when using the kn...
- Question 60: You need to create the queue for cases. What type of queue s...
- Question 61: You need to configure each escalation scenario. Which config...
- Question 62: You use Dynamics 365 for Customer Service. You need to creat...
- Question 63: A company sells and services bicycles. The company uses Dyna...
- Question 64: You are implementing Omnichannel for Customer Service for a ...
- Question 65: A company implements Dynamics 365 Customer Service. You are ...
- Question 66: You need to identify who has access to the Schedule tab and ...
- Question 67: Note: This question is part of a series of questions that pr...
- Question 68: You are creating an external-facing portal that uses capabil...
- Question 69: A company deploys Dynamics 365 Customer Service. The company...
- Question 70: You are a customer service representative using Dynamics 365...
- Question 71: You are the Dynamics 365 administrator for a help desk. You ...
- Question 72: You are a Dynamics 365 for Customer Service administrator. Y...
- Question 73: A company uses Dynamics 365 Customer Service. A client purch...
- Question 74: Note: This question is part of a series of questions that pr...
- Question 75: You are implementing a new channel within Omnichannel. You n...
- Question 76: A company is Implementing Dynamics 365 Customer Service and ...
- Question 77: You are configuring a Dynamics 365 for Customer Service inst...
- Question 78: You are a Dynamics 365 for Customer Service administrator. Y...
- Question 79: You are configuring Dynamics 365 Customer Service. Child cas...
- Question 80: A company has used Dynamics 365 Customer Service with Omnich...
- Question 81: A company uses Omnichannel for Customer Service. The company...
- Question 82: You need to implement service-level agreements. Which type o...
- Question 83: You are a Dynamics 365 for Customer Service administrator. Y...
- Question 84: You are using Dynamics 365 Customer Service to create and ac...
- Question 85: You are customizing an Omnichannel for Customer Service impl...
- Question 86: You use Dynamics 365 Customer Service to manage cases. You n...
- Question 87: You need to set up the analytics functionality. What should ...
- Question 88: What should managers use to perform weekly reviews with case...
- Question 89: A computer repair company employs technicians. Some technici...
- Question 90: A company is evaluating Dynamics 365 Customer Service Insigh...
- Question 91: You are a customer service schedule administrator for a comp...
- Question 92: A company uses Dynamics 365 Customer Voice. The company requ...
- Question 93: You create a Power Virtual Agents chatbot. The chatbot inclu...
- Question 94: A company has a service level agreement (SLA) that they will...
- Question 95: A customer service manager wants to find out how agents desc...
- Question 96: A client wants to use the knowledge base in Dynamics 365 Cus...
- Question 97: You are a customer service representative working with cases...
- Question 98: A company uses Dynamics 365 Customer Service. You need to im...
- Question 99: You are a customer service representative using Dynamics 365...
- Question 100: You are implementing Omnichannel for Customer Service for a ...
- Question 101: You manage a Dynamics 365 for Customer Service environment. ...
- Question 102: You are setting up channels for Omnichannel for Customer Ser...
- Question 103: A company uses Dynamics 365 Customer Service. The app is sha...
- Question 104: You are customizing a Dynamics 365 Customer Service implemen...
- Question 105: You are a Dynamics 365 for Customer Service administrator cr...
- Question 106: You need to enable relevance search for the custom entity. W...
- Question 107: You use multiple workspaces within Dynamics 365 Customer Ser...
- Question 108: You manage a Dynamics 365 Customer Service environment. The ...
- Question 109: You need to configure the queues. Which configurations shoul...
- Question 110: You are using Dynamics 365 for Customer Service. You have ex...
- Question 111: You need to create a new agent script for the agents. Which ...
- Question 112: You manage Dynamics 365 Customer Service. You have a routing...
- Question 113: A company uses Dynamics 365 Customer Service to provide prod...
- Question 114: Your company uses Dynamics 365 Customer Service. You are des...
- Question 115: You need to determine the type of queues to create. How shou...
- Question 116: Note: This question is part of a series of questions that pr...
- Question 117: You are a Dynamics 365 administrator. You want to set up a c...
- Question 118: A trucking company uses a custom table named Leased Truck in...
- Question 119: A company has a Customer Service deployment. The company pla...
- Question 120: A credit card company uses Dynamics 365 Customer Service. Ag...
- Question 121: A company is implementing Dynamics 365 Customer Service work...
- Question 122: You are using Dynamics 365 Customer Service. You need to ens...
- Question 123: You work for a healthcare company that does not use Azure Ac...
- Question 124: Note; This question is part of a series of questions that pr...
- Question 125: You are describing Power Virtual Agents to executives at a c...
- Question 126: A company has satellite offices that service local areas. Ea...
- Question 127: Note: This question is part of a series of questions that pr...
- Question 128: A company uses Dynamics 365 for Customer Service. A case in ...
- Question 129: You are implementing Dynamics 365 Customer Service Insights....
- Question 130: You are setting up Omnichannel for Customer Service. You nee...
- Question 131: Note: This question is part of a series of questions that pr...
- Question 132: You manage Dynamics 365 for Customer Service. You need to cr...
- Question 133: A company uses Customer Service to manage support cases and ...
- Question 134: A company that manufactures industrial heating, ventilation,...
- Question 135: You are a Dynamics 365 for Customer Service administrator. Y...
