- Home
- Microsoft
- Monitoring and Operating a Private Cloud with System Center 2012
- Microsoft.70-246.v2018-05-30.q204
- Question 110
Valid 70-246 Dumps shared by ExamDiscuss.com for Helping Passing 70-246 Exam! ExamDiscuss.com now offer the newest 70-246 exam dumps, the ExamDiscuss.com 70-246 exam questions have been updated and answers have been corrected get the newest ExamDiscuss.com 70-246 dumps with Test Engine here:
Access 70-246 Dumps Premium Version
(170 Q&As Dumps, 35%OFF Special Discount Code: freecram)
<< Prev Question Next Question >>
Question 110/204
Your company has a private cloud that is managed by using a System Center 2012 Operations Manager infrastructure.
The network contains several routers and switches.
You open the Network Devices view and discover that a switch is in a critical state.
You need to identify the availability of the switch during the past seven days. The solution must also ensure that you can review which servers are connected to the switch.
What should you use?
Correct Answer: A
Explanation/Reference:
Explanation:
http://www.techrepublic.com/blog/networking/using-the-network-dashboard-views-in-scom- 2012/5226 Network Node Dashboard View A node is any device connected to a network.
Switches and routers are among the most common kinds of nodes you will discover.
The node dashboard provides details on the health of a particular device.
The upper portion of the node dashboard consists of the network vicinity view for that node, as well as
"speedometer" gauges for node availability today, yesterday, in the last week, and in the last month.
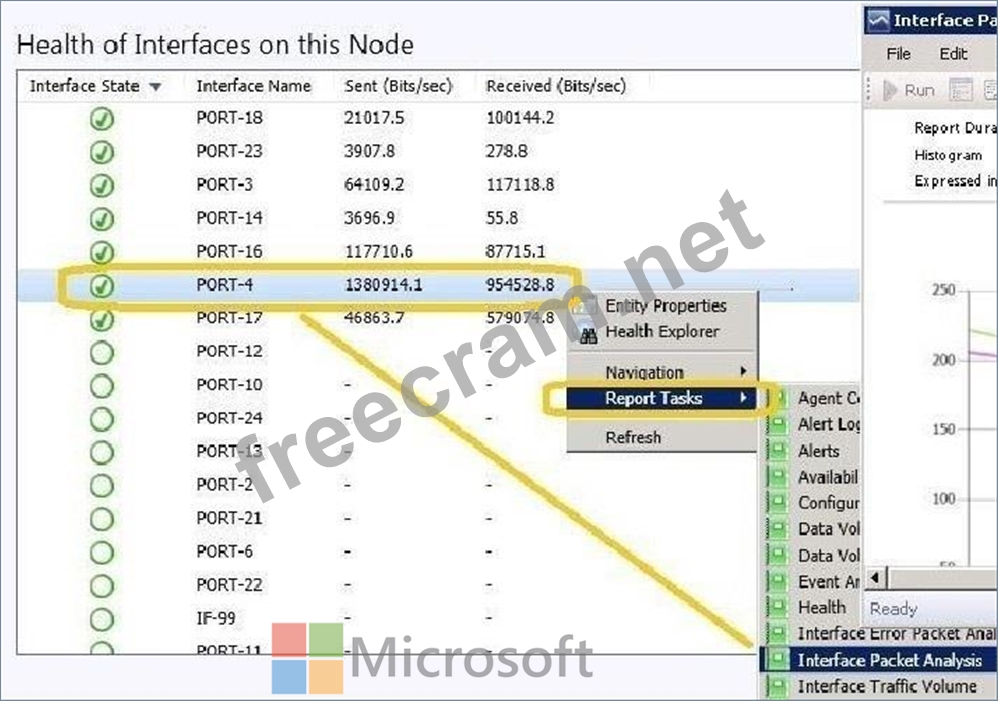
(Periods of time that were not monitored are counted as "available" in the availability statistics, so newly discovered devices will not appear to have had outages in the gauges.) The lower portion of the node dashboard includes a list of all interfaces on the node that are being monitored.
From this view, you can manually override the automatic selections of which interfaces are monitored by SCOM.
Also, by right-clicking on specific interfaces, you can pivot to performance or reporting views that drill down into the near term or long term history of an interface.
In Figure B, the Interface Packet Analysis report for "PORT 4 on "switch1 during the previous week appears in a second window.
Explanation:
http://www.techrepublic.com/blog/networking/using-the-network-dashboard-views-in-scom- 2012/5226 Network Node Dashboard View A node is any device connected to a network.
Switches and routers are among the most common kinds of nodes you will discover.
The node dashboard provides details on the health of a particular device.
The upper portion of the node dashboard consists of the network vicinity view for that node, as well as
"speedometer" gauges for node availability today, yesterday, in the last week, and in the last month.
(Periods of time that were not monitored are counted as "available" in the availability statistics, so newly discovered devices will not appear to have had outages in the gauges.) The lower portion of the node dashboard includes a list of all interfaces on the node that are being monitored.
From this view, you can manually override the automatic selections of which interfaces are monitored by SCOM.
Also, by right-clicking on specific interfaces, you can pivot to performance or reporting views that drill down into the near term or long term history of an interface.
In Figure B, the Interface Packet Analysis report for "PORT 4 on "switch1 during the previous week appears in a second window.


- Question List (204q)
- Question 1: Your company has a private cloud that is managed by using a ...
- Question 2: You need to recommend which object must be monitored from Op...
- Question 3: Your company has a private cloud that is managed by using a ...
- Question 4: You need to implement a solution to meet the monitoring requ...
- Question 5: Your company has a private cloud that contains a System Cent...
- Question 6: Your network contains an Active Directory domain named conto...
- Question 7: You need to make changes to the virtual machine template use...
- Question 8: DRAG DROP You are evaluating the deployment of System Center...
- Question 9: Your company has a private cloud that is managed by using a ...
- Question 10: You have a System Center 2012 R2 Configuration Manager Deplo...
- Question 11: You need to recommend a tool to view the performance monitor...
- Question 12: Your company has a private cloud that is managed by using a ...
- Question 13: Your company has a private cloud that contains a Microsoft A...
- Question 14: Your company deploys System Center 2012 R2 Virtual Machine M...
- Question 15: Your company has a private cloud that is managed by using a ...
- Question 16: You need to create an object that meets the incident managem...
- Question 17: Your company deploys System Center 2012 R2 Operations Manage...
- Question 18: DRAG DROP Your company has a private cloud that is managed b...
- Question 19: (Exhibit) The file server monitored by operations manager on...
- Question 20: You have two servers configured as shown in the following ta...
- Question 21: Your network contains an Active Directory domain named conto...
- Question 22: To view Application Performance Monitoring event details, yo...
- Question 23: DRAG DROP You need to recommend a solution to ensure that pr...
- Question 24: Your company has a private cloud that is managed by using a ...
- Question 25: HOTSPOT You Have a System Center 2012 R2 Operations Manager ...
- Question 26: DRAG DROP You need to implement the planned integration of C...
- Question 27: You run Active directory user and computers that were in the...
- Question 28: HOTSPOT You need to create a discover rule for the London si...
- Question 29: Your company has a private cloud that is managed by using a ...
- Question 30: You have a System Center 2012 R2 infrastructure. You plan to...
- Question 31: You manage a System Center 2012 R2 deployment that contains ...
- Question 32: You need to recommend a solution to implement the changes fo...
- Question 33: Your company has a private cloud that is managed by using a ...
- Question 34: SLA Which object is configured in operation manager?...
- Question 35: System Center 2012 allows you to configure how content distr...
- Question 36: Your company has a private cloud that is managed by using a ...
- Question 37: You need to implement the incident management changes. What ...
- Question 38: Your company has a private cloud that contains a System Cent...
- Question 39: Your company has a private cloud that is managed by using a ...
- Question 40: You work as a Network Administrator at ABC.com. The network ...
- Question 41: Your company has a private cloud that is managed by using a ...
- Question 42: Your company has a datacenter in Los Angeles. The datacenter...
- Question 43: HOTSPOT You are evaluating the implementation of an Operatio...
- Question 44: Your company has a private cloud that is managed by using a ...
- Question 45: DRAG DROP The vmm server and the vmm database are both locat...
- Question 46: Our company has a main office and 10 branch offices. The net...
- Question 47: Your company has a private cloud that is managed by using a ...
- Question 48: Your company has a private cloud that is managed by using a ...
- Question 49: Your company has a private cloud that contains a System Cent...
- Question 50: Your company has a private cloud that is managed by using a ...
- Question 51: DRAG DROP You have a System Center 2012 R2 Deployment. The r...
- Question 52: You deploy a new virtual machine named VM29 for App1. You vi...
- Question 53: You need to recommend which configurations must be performed...
- Question 54: Your company has a private cloud that is managed by using a ...
- Question 55: HOTSPOT You need to ensure that you can manage the updates t...
- Question 56: HOTSPOT You need to identify the maximum number of discovery...
- Question 57: HOTSPOT You need to recommend a solution to meet the monitor...
- Question 58: You have a System Center 2012 R2 infrastructure that has Orc...
- Question 59: Your company has a private cloud that contains a System Cent...
- Question 60: You are preparing a virtual machine that will be used as a t...
- Question 61: System Center 2012 Configuration Manager discovery identifie...
- Question 62: The network contains two servers named Server1 and Server2 t...
- Question 63: You need to recommend a solution to prepare the infrastructu...
- Question 64: Your company has a private cloud that contains a System Cent...
- Question 65: HOTSPOT You need to recommend which configurations must be p...
- Question 66: You need to recommend a solution to meet the update requirem...
- Question 67: Your company has a private cloud that is managed by using a ...
- Question 68: Your company has a private cloud that is managed by using a ...
- Question 69: HOTSPOT Your company has a private cloud that contains a Sys...
- Question 70: Your company has a datacenter in Los Angeles that contains a...
- Question 71: You need to recommend a management pack template to monitor ...
- Question 72: You need to modify the criteria SLOs. Which Service Level Ma...
- Question 73: DRAG DROP You have a System Center 2012 R2 infrastructure th...
- Question 74: You need to recommend a solution to remediate the Exchange S...
- Question 75: You virtualize all of the SharePoint servers and add them to...
- Question 76: HOTSPOT You have a System Center 2012 R2 Configuration Manag...
- Question 77: Your company has a private cloud that is managed by using a ...
- Question 78: You need to recommend a solution to manage the changes made ...
- Question 79: A primary site can support up to 10 management points. Howev...
- Question 80: Your company has a private cloud that is managed by using a ...
- Question 81: Which term is described below: A feature in Operations Manag...
- Question 82: The Network Access Account is used by client computers when ...
- Question 83: Your company has a datacenter in Los Angeles that contains a...
- Question 84: You discover that many incidents are generated for VM2. You ...
- Question 85: Your company has a private cloud that is managed by using a ...
- Question 86: You need to implement a notification solution to meet the te...
- Question 87: HOTSPOT You deploy System Center 2012 R2 Operations Manager ...
- Question 88: Your company has a private cloud that is managed by using a ...
- Question 89: You need to recommend a solution to meet the technical requi...
- Question 90: Your company has a private cloud that is managed by using a ...
- Question 91: You need to recommend a solution to ensure that the sales de...
- Question 92: You need to install the new version of App1. What should you...
- Question 93: DRAG DROP You need to recommend a solution to monitor App2. ...
- Question 94: You use System Center 2012 R2 Service Manager to manage inci...
- Question 95: HOTSPOT Your company has a private cloud that contains a Sys...
- Question 96: App1 is an .NET application you need to recommend monitoring...
- Question 97: The storage pool is a set of disks on which the DPM server s...
- Question 98: You deploy a multi-server installation of System Center 2012...
- Question 99: HOTSPOT You need to create a Service Level Tracking object t...
- Question 100: Your company has a private cloud that contains a System Cent...
- Question 101: DRAG DROP You need to implement Workflow1. Which four action...
- Question 102: Your network contains an Active Directory domain named conto...
- Question 103: Configuration Manager uses site system roles to support mana...
- Question 104: Your company has a private cloud that contains two Active Di...
- Question 105: Your company has a private cloud that is managed by using a ...
- Question 106: Your company has a datacenter in Los Angeles that contains a...
- Question 107: HOTSPOT You need to recommend a solution to meet the availab...
- Question 108: Your company has a private cloud that contains a System Cent...
- Question 109: HOTSPOT Your company help desk uses System Center 2012 Servi...
- Question 110: Your company has a private cloud that is managed by using a ...
- Question 111: Your company has a private cloud that contains a System Cent...
- Question 112: HOTSPOT Your company has a private cloud that contains a Sys...
- Question 113: DRAG DROP Your company has a private cloud that contains a S...
- Question 114: You need to recommend a solution to monitor the UNIX-based w...
- Question 115: You need to ensure that the owners of virtual machines are n...
- Question 116: DRAG DROP Your company has a private cloud that is managed b...
- Question 117: You need to implement the alert notifications. The solution ...
- Question 118: Your company has a private cloud that is managed by using a ...
- Question 119: You need to perform IAAS on demand backup of server2 with mo...
- Question 120: Your company has a private cloud that is managed by using a ...
- Question 121: You need to ensure that the self-service users and the admin...
- Question 122: Which of these answers is FALSE regarding System Center 2012...
- Question 123: DRAG DROP Your company has a private cloud that is managed b...
- Question 124: DRAG DROP You need to implement and test the runbook-based s...
- Question 125: Your role of Systems Administrator at ABC.com includes the m...
- Question 126: You need to recommend a solution to meet the technical requi...
- Question 127: You need to implement end-of day processing for Relecloud. W...
- Question 128: HOTSPOT Your company has a private cloud that is managed by ...
- Question 129: Your company has a private cloud that is managed by using a ...
- Question 130: You need to recommend a solution to resolve the monitoring i...
- Question 131: You need to recommend a solution to meet the monitoring requ...
- Question 132: DRAG DROP You are evaluating the implementation of additiona...
- Question 133: You need to identify which systems you will be able to view ...
- Question 134: You need to recommend a solution to meet the monitoring requ...
- Question 135: DRAG DROP You need to prepare the infrastructure to meet the...
- Question 136: DRAG DROP You need to prepare the environment to support the...
- Question 137: You need to recommend which Orchestrator integration packs m...
- Question 138: System Center 2012 Configuration Manager uses site system ro...
- Question 139: HOTSPOT Your company uses System Center 2012 Service Manager...
- Question 140: HOTSPOT Your network contains a System Center 2012 R2 Servic...
- Question 141: DRAG DROP Your company has a private cloud that is managed b...
- Question 142: When you install a Configuration Manager site, several defau...
- Question 143: DRAG DROP Your company has a private cloud that is managed b...
- Question 144: HOTSPOT You have a System Center 2012 R2 infrastructure that...
- Question 145: HOTSPOT You need to identify the minimum number of Operation...
- Question 146: You deploy System Center 2012 Operations Manager. You create...
- Question 147: For a typical DPM deployment there is a recommended RAID con...
- Question 148: Application management in System Center 2012 Configuration M...
- Question 149: Via Operations Manager you can use the Operations console to...
- Question 150: You need to ensure that users can self provision virtual mac...
- Question 151: DRAG DROP You are evaluating the deployment of System Center...
- Question 152: Your company has a private cloud that contains a System Cent...
- Question 153: You need to implement a solution to meet the IM requirements...
- Question 154: HOTSPOT You manage a System Center 2012 R2 Operations Manage...
- Question 155: Your company has a private cloud that is managed by using a ...
- Question 156: Daily recovery point size refers to the total size of change...
- Question 157: You need to recommend a solution to monitor the SharePoint S...
- Question 158: DRAG DROP You create a virtual machine template for the BizT...
- Question 159: Your network contains a single Active Directory domain. The ...
- Question 160: Your company has a private cloud that is managed by using a ...
- Question 161: You need to implement the planned reporting changes after th...
- Question 162: You need to identify which backup solution meets the technic...
- Question 163: You need to recommend a solution to implement the planned ch...
- Question 164: HOTSPOT You need to recommend a compliance solution for the ...
- Question 165: HOTSPOT Your Company deploys System Center 2012 R2 VMM and S...
- Question 166: How many clients can be supported when SQL Server is install...
- Question 167: HOTSPOT Your company has a private cloud that contains a Sys...
- Question 168: HOTSPOT FROM a Relecoud new Case Study pi is a runbook. You ...
- Question 169: Your company has a private cloud that is managed by using a ...
- Question 170: You deploy a System Center 2012 R2 infrastructure that conta...
- Question 171: Your company has a datacenter in Los Angeles that contains a...
- Question 172: Your company has a datacenter in Los Angeles. The datacenter...
- Question 173: Your role of Systems Administrator at ABC.com includes the m...
- Question 174: HOTSPOT You have a System Center 2012 R2 deployment that con...
- Question 175: HOTSPOT You need to recommend changes to the System Center 2...
- Question 176: You need to recommend a solution to meet the compliance requ...
- Question 177: Your company has a private cloud that is managed by using a ...
- Question 178: Your Company Host a public cloud that provides virtual machi...
- Question 179: You need to view the incidents and the related configuration...
- Question 180: Your company has a private cloud that is managed by using a ...
- Question 181: Your company has a datacenter in Los Angeles. The datacenter...
- Question 182: You need to recommend a solution to resolve the security iss...
- Question 183: You have a System Center 2012 Operations Manager infrastruct...
- Question 184: DRAG DROP You plan to automate a task by using System Center...
- Question 185: You need to recommend a solution for the application servers...
- Question 186: You need to recommend a solution to meet the alerts requirem...
- Question 187: Your network contains an Active Directory domain named conto...
- Question 188: Your company has a private cloud that is managed by using a ...
- Question 189: You need to recommend an automated solution to resolve the t...
- Question 190: HOTSPOT Your company has a private cloud that contains a Sys...
- Question 191: Your company has a private cloud that is managed by using a ...
- Question 192: You need to recommend a solution to apply patches to the SQL...
- Question 193: You need to recommend a solution to meet the monitoring requ...
- Question 194: Your role of Systems Administrator at ABC.com includes the m...
- Question 195: You need to identify the information that is required to dis...
- Question 196: You need to recommend a solution to meet the technical requi...
- Question 197: Your company has a private cloud that is managed by using a ...
- Question 198: HOTSPOT Your company has a private cloud that is managed by ...
- Question 199: DRAG DROP You need to configure the environment to meet the ...
- Question 200: Your company has a private cloud that is managed by using a ...
- Question 201: You need to recommend a solution to monitor all of the virtu...
- Question 202: You need to recommend which System Center 2012 component mus...
- Question 203: Your role of Systems Administrator at ABC.com includes the m...
- Question 204: Your company has a private cloud that is managed by using a ...
