Valid PL-300 Dumps shared by ExamDiscuss.com for Helping Passing PL-300 Exam! ExamDiscuss.com now offer the newest PL-300 exam dumps, the ExamDiscuss.com PL-300 exam questions have been updated and answers have been corrected get the newest ExamDiscuss.com PL-300 dumps with Test Engine here:
Access PL-300 Dumps Premium Version
(452 Q&As Dumps, 35%OFF Special Discount Code: freecram)
<< Prev Question Next Question >>
Question 71/223
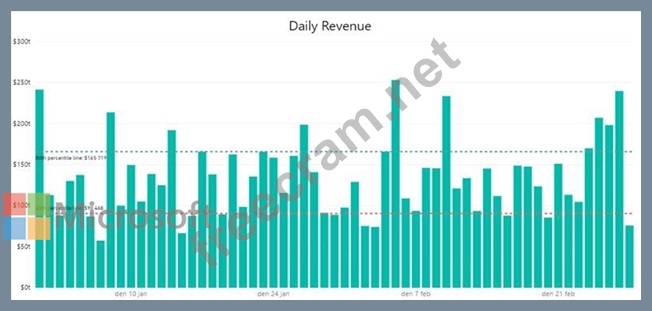
You plan to create the chart shown in the following exhibit.

How should you create the dashed horizontal line denoting the 40th percentile of daily sales for the period shown?
How should you create the dashed horizontal line denoting the 40th percentile of daily sales for the period shown?
Correct Answer: C
The analytics feature enables you to show percentiles across groups specified along a specific axis.
Example:
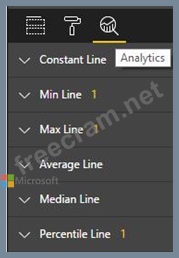
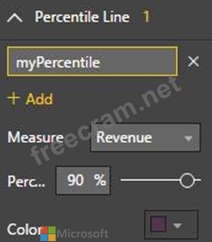
1. Click on the analytics tab
2. Select Percentile
3. You can choose a specific percentile along with other formatting options.
4. Drag a date or non-numeric dimension into the Axis of a column chart
Add percentile lines to monitor daily revenue
Incorrect Answers:
B, D: There are two main percentile functions in Power BI:
PERCENTILE.EXC(column, kth percentile)
PERCENTILE.INC(column, kth percentile)
The first parameter is the column which you want the percentile value for.
The second parameter is the kth percentile where k percentage of values will fall below.
Both formulas use a slightly different algorithm. The second algorithm works for any value of k between 0 and 1 (the 0th and 100th percentile). In the EXC version the data excludes both lower and upper bounds, while INC includes them.
Reference:
https://www.dash-intel.com/powerbi/statistical_functions_percentile.php
Example:
1. Click on the analytics tab
2. Select Percentile
3. You can choose a specific percentile along with other formatting options.
4. Drag a date or non-numeric dimension into the Axis of a column chart
Add percentile lines to monitor daily revenue
Incorrect Answers:
B, D: There are two main percentile functions in Power BI:
PERCENTILE.EXC(column, kth percentile)
PERCENTILE.INC(column, kth percentile)
The first parameter is the column which you want the percentile value for.
The second parameter is the kth percentile where k percentage of values will fall below.
Both formulas use a slightly different algorithm. The second algorithm works for any value of k between 0 and 1 (the 0th and 100th percentile). In the EXC version the data excludes both lower and upper bounds, while INC includes them.
Reference:
https://www.dash-intel.com/powerbi/statistical_functions_percentile.php


- Question List (223q)
- Question 1: You have a CSV file that contains user complaints. The file ...
- Question 2: You use Power BI Desktop to open a PBIX file that contains a...
- Question 3: You plan to join a fact table named ActivityLog to a Date di...
- Question 4: You have a Microsoft Power BI report. The size of PBIX file ...
- Question 5: Hotspot Question You are enhancing a Power BI model that has...
- Question 6: You have a Power Bi report for the procurement department. T...
- Question 7: You have a Power BI model that contains a table named Employ...
- Question 8: You have a collection of reports for the HR department of yo...
- Question 9: Hotspot Question You are creating a column chart visualizati...
- Question 10: Case Study 4 - Contoso Ltd 2 Overview Contoso, Ltd. is a man...
- Question 11: You are using the key influencers visual to identify which f...
- Question 12: You have a Power BI semantic model named Model1 that contain...
- Question 13: Drag and Drop Question You have a Microsoft Excel spreadshee...
- Question 14: Hotspot Question You use Power Query Editor to review the qu...
- Question 15: You have a Power BI model that contains a table named Date. ...
- Question 16: You have a dashboard that contains tiles pinned from a singl...
- Question 17: Hotspot Question You are creating reports in Power BI Deskto...
- Question 18: You have a Power Bi report. The report contains a visual tha...
- Question 19: Drag and Drop Question You have the line chart shown in the ...
- Question 20: In Power BI Desktop, you have a dataset that contains a tabl...
- Question 21: You have a Power BI data model that imports data from a Micr...
- Question 22: You are creating a Power Bl report by using Power Bi Desktop...
- Question 23: You use an R visual to produce a map of 500,000 customers. Y...
- Question 24: You use Power Query Editor to preview a query that contains ...
- Question 25: You import a Power Bl dataset that contains the following ta...
- Question 26: Note: This question is part of a series of questions that pr...
- Question 27: You are developing a sales report that will have multiple pa...
- Question 28: You have a Power BI dataset named Finance that is hosted in ...
- Question 29: Drag and Drop Question You have a Microsoft Excel workbook t...
- Question 30: You have a Power BI report that contains a table visual. The...
- Question 31: You have a report that includes a card visualization. You ne...
- Question 32: You have a Power BI semantic model named Model1 that runs in...
- Question 33: Case Study 3 - Northwind Traders Overview. General Overview ...
- Question 34: You have a table that contains sales data and approximately ...
- Question 35: Case Study 2 - Contoso Ltd Overview Existing Environment Con...
- Question 36: Note: This question is part of a series of questions that pr...
- Question 37: You open a query in Power Query Editor. You need to identify...
- Question 38: Note: This question is part of a series of questions that pr...
- Question 39: You plan to create a dashboard in the Power BI service that ...
- Question 40: You have a report that contains a donut chart and a clustere...
- Question 41: Hotspot Question You use Power Query Editor to review a quer...
- Question 42: Drag and Drop Question You publish a dataset that contains d...
- Question 43: You are creating a new semantic model in Microsoft Power BI ...
- Question 44: Hotspot Question You attempt to use Power Query Editor to cr...
- Question 45: You have a Power Bl report for the marketing department. The...
- Question 46: Hotspot Question You have a Power BI tenant that contains a ...
- Question 47: Hotspot Question You have a Power BI imported dataset that c...
- Question 48: You need to create a semantic model in Power BI Desktop. The...
- Question 49: You have a Microsoft Power BI data model that contains three...
- Question 50: Case Study 1 - Litware, Inc. Overview Litware, Inc. is an on...
- Question 51: Note: This question is part of a series of questions that pr...
- Question 52: Drag and Drop Question You have a Power BI report that conta...
- Question 53: You publish a Microsoft Power BI dataset to powerbi.com. The...
- Question 54: You have a Power BI dashboard that displays different visual...
- Question 55: Note: This question is part of a series of questions that us...
- Question 56: Your organization has a team of power users who recently cre...
- Question 57: Hotspot Question You have a Power BI semantic model named Mo...
- Question 58: You have a Microsoft Power Bl report. The size of PBIX file ...
- Question 59: Case Study 1 - Litware, Inc. Overview Litware, Inc. is an on...
- Question 60: You have an on-premises Power BI Report Server. You plan to ...
- Question 61: Hotspot Question You plan to create the Power BI model shown...
- Question 62: Drag and Drop Question You are using existing reports to bui...
- Question 63: Drag and Drop Question You plan to use Power BI to create a ...
- Question 64: You have multiple dashboards. You need to ensure that when u...
- Question 65: You have a Power BI model for sales data. You create a measu...
- Question 66: Hotspot Question You have a Power Bl report named Orders tha...
- Question 67: Hotspot Question You have two tables named Customers and Inv...
- Question 68: You plan to develop a Power BI report that has a bar chart t...
- Question 69: Hotspot Question You open powerbi.com as shown in the follow...
- Question 70: Hotspot Question You have an API that returns more than 100 ...
- Question 71: You plan to create the chart shown in the following exhibit....
- Question 72: You have a Power Bl query named Sates that imports the colum...
- Question 73: Case Study 1 - Litware, Inc. Overview Litware, Inc. is an on...
- Question 74: Note: This question is part of a series of questions that pr...
- Question 75: From the Home tab in Power BI Desktop, you click Enter Data ...
- Question 76: You have two tables named Customer and Orders. A sample of t...
- Question 77: You have a Power BI semantic model that contains a table nam...
- Question 78: Case Study 4 - Contoso Ltd 2 Overview Contoso, Ltd. is a man...
- Question 79: Hotspot Question You have the data lineage shown in the foll...
- Question 80: You have a CSV file that contains user complaints. The file ...
- Question 81: You have a sales system that contains the tables shown in th...
- Question 82: Case Study 2 - Contoso Ltd Overview Existing Environment Con...
- Question 83: You have a Power BI semantic model that contains the followi...
- Question 84: From Power BI Desktop, you publish a new dataset and report ...
- Question 85: Drag and Drop Question You have a Power BI report that conta...
- Question 86: You have a Power BI data model that contains two tables name...
- Question 87: Case Study 4 - Contoso Ltd 2 Overview Contoso, Ltd. is a man...
- Question 88: Hotspot Question You have a report in Power BI Desktop. You ...
- Question 89: Hotspot Question You have a Power BI workspace that contains...
- Question 90: You have a Power BI dataset that contains quarterly sales pe...
- Question 91: You have a Power BI model that contains a table named Employ...
- Question 92: Case Study 2 - Contoso Ltd Overview Existing Environment Con...
- Question 93: Drag and Drop Question You use Power Query Editor to import ...
- Question 94: In Power Bi Desktop, you are creating visualizations in a re...
- Question 95: Hotspot Question You have a folder of monthly transaction ex...
- Question 96: You have a Power BI report that contains four pages. All the...
- Question 97: In Power Query Editor, you have a query named Sales Data tha...
- Question 98: You are creating a Power BI report to analyze consumer purch...
- Question 99: Hotspot Question You have a Power BI semantic model named Mo...
- Question 100: You have a Power B1 report that contains three pages named P...
- Question 101: You create the following step by using Power Query Editor. =...
- Question 102: You have a line chart that shows the number of employees in ...
- Question 103: Note: This question is part of a series of questions that pr...
- Question 104: Hotspot Question You have a Power BI report that contains a ...
- Question 105: Note: This question is part of a series of questions that pr...
- Question 106: You plan to embed multiple visualization in a public website...
- Question 107: Drag and Drop Question You use Power Query Editor to preview...
- Question 108: Hotspot Question You have a Power BI semantic model named Mo...
- Question 109: Case Study 1 - Litware, Inc. Overview Litware, Inc. is an on...
- Question 110: Drag and Drop Question You are modifying a Power BI model by...
- Question 111: From Power Query Editor, you attempt to execute a query and ...
- Question 112: You need to use Power BI to create a visual that will allow ...
- Question 113: Drag and Drop Question You have a Microsoft Excel workbook t...
- Question 114: For the sales department at your company, you publish a Powe...
- Question 115: You have a Microsoft Power BI report. The size of PBIX file ...
- Question 116: Note: This question is part of a series of questions that pr...
- Question 117: You have a PBIX file that imports data from a Microsoft Exce...
- Question 118: Note: This question is part of a series of questions that pr...
- Question 119: You create a report by using Microsoft Power BI Desktop. The...
- Question 120: You have five sales regions. Each region is assigned a singl...
- Question 121: Note: This question is part of a series of questions that pr...
- Question 122: You use Power Query to import two tables named Order Header ...
- Question 123: Drag and Drop Question You create a data model in Power BI. ...
- Question 124: Hotspot Question You are designing the data model for a Powe...
- Question 125: Case Study 2 - Contoso Ltd Overview Existing Environment Con...
- Question 126: You have a Power BI model that contains two tables named Pop...
- Question 127: Drag and Drop Question You are preparing a financial report ...
- Question 128: Note: This question is part of a series of questions that pr...
- Question 129: You have a CSV file that contains user complaints. The file ...
- Question 130: You have a Power BI tenant that contains a workspace named W...
- Question 131: You have an app workspace that contains a dashboard and four...
- Question 132: You are building a Power BI report. Users will view the repo...
- Question 133: Hotspot Question You have a table that contains a column nam...
- Question 134: Note: This question is part of a series of questions that pr...
- Question 135: You have a Power BI report. The report contains a line chart...
- Question 136: Case Study 3 - Northwind Traders Overview. General Overview ...
- Question 137: You have a Power BI report that uses a dataset based on an A...
- Question 138: You build a Power BI report that displays IoT temperature da...
- Question 139: You have a Power BI dataset and a connected report. You need...
- Question 140: Hotspot Question You are profiling data by using Power Query...
- Question 141: You plan to use Power BI Desktop optimized for Power BI Repo...
- Question 142: Hotspot Question You use Power Query Editor to pull data fro...
- Question 143: Drag and Drop Question You need to use AI insights to add a ...
- Question 144: You have a report that contains four pages. Each page contai...
- Question 145: Case Study 2 - Contoso Ltd Overview Existing Environment Con...
- Question 146: Case Study 3 - Northwind Traders Overview. General Overview ...
- Question 147: Hotspot Question You need to create a Power Bl report. The f...
- Question 148: You have a Power BI app named App1. The privacy for the App1...
- Question 149: Note: This question is a part of a series of questions that ...
- Question 150: Hotspot Question You have the Power BI data model shown in t...
- Question 151: Note: This question is part of a series of questions that us...
- Question 152: You have a Power BI query named Expenses that imports the fo...
- Question 153: You are creating a report in Power BI Desktop. You load a da...
- Question 154: You publish a dataset to the Power BI service. The dataset c...
- Question 155: You have a Power Bl report hosted on powerbi.com that displa...
- Question 156: You create a Power BI workspace named Workspace1. You publis...
- Question 157: Drag and Drop Question You have a folder that contains 100 C...
- Question 158: You have the visual shown in the exhibit. (Exhibit) You need...
- Question 159: You build a report to help the sales team understand its per...
- Question 160: Hotspot Question You use Power Query Editor to preview the d...
- Question 161: Case Study 3 - Northwind Traders Overview. General Overview ...
- Question 162: You are creating a visual to show the ranking of product cat...
- Question 163: You plan to create a dashboard in the Power BI service that ...
- Question 164: Hotspot Question You are building a financial report by usin...
- Question 165: Note: This question is part of a series of questions that pr...
- Question 166: You are developing a report page. Some users will navigate t...
- Question 167: You have a dataset that is used infrequently and refreshes e...
- Question 168: You use Power Query Editor to import and preview sales data ...
- Question 169: You have an Azure SQL database that contains sales transacti...
- Question 170: Case Study 1 - Litware, Inc. Overview Litware, Inc. is an on...
- Question 171: You have a Power BI model that contains the following data. ...
- Question 172: You are creating a sales report in Power Bl for the NorthWes...
- Question 173: Case Study 2 - Contoso Ltd Overview Existing Environment Con...
- Question 174: Hotspot Question You are creating a Microsoft Power BI impor...
- Question 175: Case Study 1 - Litware, Inc. Overview Litware, Inc. is an on...
- Question 176: You have a PBiX file that imports several tables from an Azu...
- Question 177: Drag and Drop Question You build a report about warehouse in...
- Question 178: You have a Microsoft SharePoint Online site that contains se...
- Question 179: Your company has employees in 10 states. The company recentl...
- Question 180: Case Study 2 - Contoso Ltd Overview Existing Environment Con...
- Question 181: You create a dataset sourced from dozens of flat files in Az...
- Question 182: Hotspot Question You have a Power BI semantic model that con...
- Question 183: Hotspot Question You have a Power BI semantic model named Mo...
- Question 184: You have the CSV file shown in the following table. (Exhibit...
- Question 185: Hotspot Question You are profiling data by using Power Query...
- Question 186: You plan to use Power BI Desktop to create a bug tracking da...
- Question 187: You are building a Power B1 report to analyze customer segme...
- Question 188: You have a Power BI semantic model named Model1 that runs in...
- Question 189: Note: This question is part of a series of questions that us...
- Question 190: Hotspot Question You are creating a Microsoft Power Bl model...
- Question 191: Hotspot Question You have a Power BI data model that contain...
- Question 192: Note: This question is part of a series of questions that pr...
- Question 193: You have a collection of reports for the HR department of yo...
- Question 194: You have a Power BI workspace named BI Data that contains a ...
- Question 195: You are building a Power Bl report that uses data from an Az...
- Question 196: You plan to use Power BI to create sales invoices for custom...
- Question 197: You have a Power BI dashboard that monitors the quality of m...
- Question 198: You use Power Query Editor to preview a column named Date as...
- Question 199: Hotspot Question You have two Power BI workspaces named Work...
- Question 200: Hotspot Question You are creating a line chart in a Power BI...
- Question 201: Note: This question is part of a series of questions that pr...
- Question 202: Note: This question is part of a series of questions that pr...
- Question 203: You have a Microsoft SharePoint Online site that contains se...
- Question 204: You have the dashboard shown in the following exhibit. (Exhi...
- Question 205: Hotspot Question You are profiling data by using Power Query...
- Question 206: You have a Microsoft Power BI Desktop report named Report1 t...
- Question 207: You have more than 100 published datasets. Ten of the datase...
- Question 208: Hotspot Question You have the Azure SQL databases shown in t...
- Question 209: Note: This question is part of a series of questions that us...
- Question 210: You have a CSV file that contains user complaints. The file ...
- Question 211: Drag and Drop Question You have a Power BI table named Custo...
- Question 212: Hotspot Question You use Power Query Editor to preview the d...
- Question 213: You have a Power BI semantic model that connects to a stream...
- Question 214: Drag and Drop Question You are creating a Power Bi model and...
- Question 215: You import two Microsoft Excel tables named Customer and Add...
- Question 216: Drag and Drop Question In Power Query Editor, you have three...
- Question 217: Drag and Drop Question You have a Power Bl workspace that co...
- Question 218: You have a custom connector that returns ID, From, To, Subje...
- Question 219: A business intelligence (Bl) developer creates a dataflow in...
- Question 220: Hotspot Question You have a Power BI model that has the foll...
- Question 221: You have sales data in a star schema that contains four tabl...
- Question 222: Case Study 3 - Northwind Traders Overview. General Overview ...
- Question 223: Drag and Drop Question You have a query named Customer that ...
