Valid PL-300 Dumps shared by EduDump.com for Helping Passing PL-300 Exam! EduDump.com now offer the newest PL-300 exam dumps, the EduDump.com PL-300 exam questions have been updated and answers have been corrected get the newest EduDump.com PL-300 dumps with Test Engine here:
Access PL-300 Dumps Premium Version
(515 Q&As Dumps, 35%OFF Special Discount Code: freecram)
<< Prev Question Next Question >>
Question 185/223
Hotspot Question
You are profiling data by using Power Query Editor.
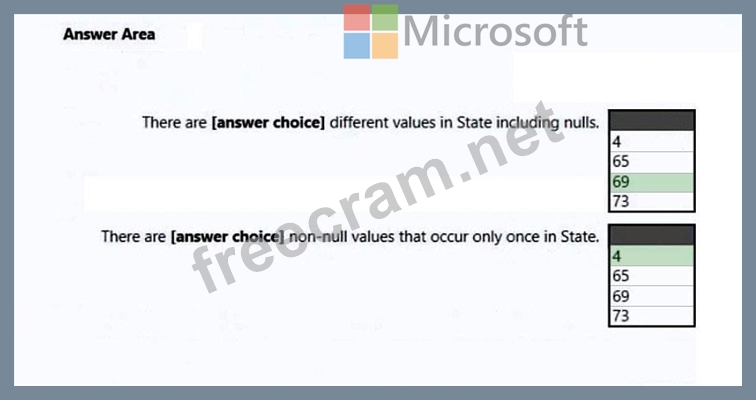
You have a table named Reports that contains a column named State. The distribution and quality data metrics for the data in State is shown in the following exhibit.

Use the drop-down menus to select the answer choice that completes each statement based on the information presented in the graphic.
NOTE: Each correct selection is worth one point.

You are profiling data by using Power Query Editor.
You have a table named Reports that contains a column named State. The distribution and quality data metrics for the data in State is shown in the following exhibit.
Use the drop-down menus to select the answer choice that completes each statement based on the information presented in the graphic.
NOTE: Each correct selection is worth one point.
Correct Answer:
Explanation:
Box 1: 69
69 distinct/different values.
Note: Column Distribution allows you to get a sense for the overall distribution of values within a column in your data previews, including the count of distinct values (total number of different values found in a given column) and unique values (total number of values that only appear once in a given column).
Box 2: 4
Reference:
https://systemmanagement.ro/2018/10/16/power-bi-data-profiling-distinct-vs-unique/


- Question List (223q)
- Question 1: You have a CSV file that contains user complaints. The file ...
- Question 2: You use Power BI Desktop to open a PBIX file that contains a...
- Question 3: You plan to join a fact table named ActivityLog to a Date di...
- Question 4: You have a Microsoft Power BI report. The size of PBIX file ...
- Question 5: Hotspot Question You are enhancing a Power BI model that has...
- Question 6: You have a Power Bi report for the procurement department. T...
- Question 7: You have a Power BI model that contains a table named Employ...
- Question 8: You have a collection of reports for the HR department of yo...
- Question 9: Hotspot Question You are creating a column chart visualizati...
- Question 10: Case Study 4 - Contoso Ltd 2 Overview Contoso, Ltd. is a man...
- Question 11: You are using the key influencers visual to identify which f...
- Question 12: You have a Power BI semantic model named Model1 that contain...
- Question 13: Drag and Drop Question You have a Microsoft Excel spreadshee...
- Question 14: Hotspot Question You use Power Query Editor to review the qu...
- Question 15: You have a Power BI model that contains a table named Date. ...
- Question 16: You have a dashboard that contains tiles pinned from a singl...
- Question 17: Hotspot Question You are creating reports in Power BI Deskto...
- Question 18: You have a Power Bi report. The report contains a visual tha...
- Question 19: Drag and Drop Question You have the line chart shown in the ...
- Question 20: In Power BI Desktop, you have a dataset that contains a tabl...
- Question 21: You have a Power BI data model that imports data from a Micr...
- Question 22: You are creating a Power Bl report by using Power Bi Desktop...
- Question 23: You use an R visual to produce a map of 500,000 customers. Y...
- Question 24: You use Power Query Editor to preview a query that contains ...
- Question 25: You import a Power Bl dataset that contains the following ta...
- Question 26: Note: This question is part of a series of questions that pr...
- Question 27: You are developing a sales report that will have multiple pa...
- Question 28: You have a Power BI dataset named Finance that is hosted in ...
- Question 29: Drag and Drop Question You have a Microsoft Excel workbook t...
- Question 30: You have a Power BI report that contains a table visual. The...
- Question 31: You have a report that includes a card visualization. You ne...
- Question 32: You have a Power BI semantic model named Model1 that runs in...
- Question 33: Case Study 3 - Northwind Traders Overview. General Overview ...
- Question 34: You have a table that contains sales data and approximately ...
- Question 35: Case Study 2 - Contoso Ltd Overview Existing Environment Con...
- Question 36: Note: This question is part of a series of questions that pr...
- Question 37: You open a query in Power Query Editor. You need to identify...
- Question 38: Note: This question is part of a series of questions that pr...
- Question 39: You plan to create a dashboard in the Power BI service that ...
- Question 40: You have a report that contains a donut chart and a clustere...
- Question 41: Hotspot Question You use Power Query Editor to review a quer...
- Question 42: Drag and Drop Question You publish a dataset that contains d...
- Question 43: You are creating a new semantic model in Microsoft Power BI ...
- Question 44: Hotspot Question You attempt to use Power Query Editor to cr...
- Question 45: You have a Power Bl report for the marketing department. The...
- Question 46: Hotspot Question You have a Power BI tenant that contains a ...
- Question 47: Hotspot Question You have a Power BI imported dataset that c...
- Question 48: You need to create a semantic model in Power BI Desktop. The...
- Question 49: You have a Microsoft Power BI data model that contains three...
- Question 50: Case Study 1 - Litware, Inc. Overview Litware, Inc. is an on...
- Question 51: Note: This question is part of a series of questions that pr...
- Question 52: Drag and Drop Question You have a Power BI report that conta...
- Question 53: You publish a Microsoft Power BI dataset to powerbi.com. The...
- Question 54: You have a Power BI dashboard that displays different visual...
- Question 55: Note: This question is part of a series of questions that us...
- Question 56: Your organization has a team of power users who recently cre...
- Question 57: Hotspot Question You have a Power BI semantic model named Mo...
- Question 58: You have a Microsoft Power Bl report. The size of PBIX file ...
- Question 59: Case Study 1 - Litware, Inc. Overview Litware, Inc. is an on...
- Question 60: You have an on-premises Power BI Report Server. You plan to ...
- Question 61: Hotspot Question You plan to create the Power BI model shown...
- Question 62: Drag and Drop Question You are using existing reports to bui...
- Question 63: Drag and Drop Question You plan to use Power BI to create a ...
- Question 64: You have multiple dashboards. You need to ensure that when u...
- Question 65: You have a Power BI model for sales data. You create a measu...
- Question 66: Hotspot Question You have a Power Bl report named Orders tha...
- Question 67: Hotspot Question You have two tables named Customers and Inv...
- Question 68: You plan to develop a Power BI report that has a bar chart t...
- Question 69: Hotspot Question You open powerbi.com as shown in the follow...
- Question 70: Hotspot Question You have an API that returns more than 100 ...
- Question 71: You plan to create the chart shown in the following exhibit....
- Question 72: You have a Power Bl query named Sates that imports the colum...
- Question 73: Case Study 1 - Litware, Inc. Overview Litware, Inc. is an on...
- Question 74: Note: This question is part of a series of questions that pr...
- Question 75: From the Home tab in Power BI Desktop, you click Enter Data ...
- Question 76: You have two tables named Customer and Orders. A sample of t...
- Question 77: You have a Power BI semantic model that contains a table nam...
- Question 78: Case Study 4 - Contoso Ltd 2 Overview Contoso, Ltd. is a man...
- Question 79: Hotspot Question You have the data lineage shown in the foll...
- Question 80: You have a CSV file that contains user complaints. The file ...
- Question 81: You have a sales system that contains the tables shown in th...
- Question 82: Case Study 2 - Contoso Ltd Overview Existing Environment Con...
- Question 83: You have a Power BI semantic model that contains the followi...
- Question 84: From Power BI Desktop, you publish a new dataset and report ...
- Question 85: Drag and Drop Question You have a Power BI report that conta...
- Question 86: You have a Power BI data model that contains two tables name...
- Question 87: Case Study 4 - Contoso Ltd 2 Overview Contoso, Ltd. is a man...
- Question 88: Hotspot Question You have a report in Power BI Desktop. You ...
- Question 89: Hotspot Question You have a Power BI workspace that contains...
- Question 90: You have a Power BI dataset that contains quarterly sales pe...
- Question 91: You have a Power BI model that contains a table named Employ...
- Question 92: Case Study 2 - Contoso Ltd Overview Existing Environment Con...
- Question 93: Drag and Drop Question You use Power Query Editor to import ...
- Question 94: In Power Bi Desktop, you are creating visualizations in a re...
- Question 95: Hotspot Question You have a folder of monthly transaction ex...
- Question 96: You have a Power BI report that contains four pages. All the...
- Question 97: In Power Query Editor, you have a query named Sales Data tha...
- Question 98: You are creating a Power BI report to analyze consumer purch...
- Question 99: Hotspot Question You have a Power BI semantic model named Mo...
- Question 100: You have a Power B1 report that contains three pages named P...
- Question 101: You create the following step by using Power Query Editor. =...
- Question 102: You have a line chart that shows the number of employees in ...
- Question 103: Note: This question is part of a series of questions that pr...
- Question 104: Hotspot Question You have a Power BI report that contains a ...
- Question 105: Note: This question is part of a series of questions that pr...
- Question 106: You plan to embed multiple visualization in a public website...
- Question 107: Drag and Drop Question You use Power Query Editor to preview...
- Question 108: Hotspot Question You have a Power BI semantic model named Mo...
- Question 109: Case Study 1 - Litware, Inc. Overview Litware, Inc. is an on...
- Question 110: Drag and Drop Question You are modifying a Power BI model by...
- Question 111: From Power Query Editor, you attempt to execute a query and ...
- Question 112: You need to use Power BI to create a visual that will allow ...
- Question 113: Drag and Drop Question You have a Microsoft Excel workbook t...
- Question 114: For the sales department at your company, you publish a Powe...
- Question 115: You have a Microsoft Power BI report. The size of PBIX file ...
- Question 116: Note: This question is part of a series of questions that pr...
- Question 117: You have a PBIX file that imports data from a Microsoft Exce...
- Question 118: Note: This question is part of a series of questions that pr...
- Question 119: You create a report by using Microsoft Power BI Desktop. The...
- Question 120: You have five sales regions. Each region is assigned a singl...
- Question 121: Note: This question is part of a series of questions that pr...
- Question 122: You use Power Query to import two tables named Order Header ...
- Question 123: Drag and Drop Question You create a data model in Power BI. ...
- Question 124: Hotspot Question You are designing the data model for a Powe...
- Question 125: Case Study 2 - Contoso Ltd Overview Existing Environment Con...
- Question 126: You have a Power BI model that contains two tables named Pop...
- Question 127: Drag and Drop Question You are preparing a financial report ...
- Question 128: Note: This question is part of a series of questions that pr...
- Question 129: You have a CSV file that contains user complaints. The file ...
- Question 130: You have a Power BI tenant that contains a workspace named W...
- Question 131: You have an app workspace that contains a dashboard and four...
- Question 132: You are building a Power BI report. Users will view the repo...
- Question 133: Hotspot Question You have a table that contains a column nam...
- Question 134: Note: This question is part of a series of questions that pr...
- Question 135: You have a Power BI report. The report contains a line chart...
- Question 136: Case Study 3 - Northwind Traders Overview. General Overview ...
- Question 137: You have a Power BI report that uses a dataset based on an A...
- Question 138: You build a Power BI report that displays IoT temperature da...
- Question 139: You have a Power BI dataset and a connected report. You need...
- Question 140: Hotspot Question You are profiling data by using Power Query...
- Question 141: You plan to use Power BI Desktop optimized for Power BI Repo...
- Question 142: Hotspot Question You use Power Query Editor to pull data fro...
- Question 143: Drag and Drop Question You need to use AI insights to add a ...
- Question 144: You have a report that contains four pages. Each page contai...
- Question 145: Case Study 2 - Contoso Ltd Overview Existing Environment Con...
- Question 146: Case Study 3 - Northwind Traders Overview. General Overview ...
- Question 147: Hotspot Question You need to create a Power Bl report. The f...
- Question 148: You have a Power BI app named App1. The privacy for the App1...
- Question 149: Note: This question is a part of a series of questions that ...
- Question 150: Hotspot Question You have the Power BI data model shown in t...
- Question 151: Note: This question is part of a series of questions that us...
- Question 152: You have a Power BI query named Expenses that imports the fo...
- Question 153: You are creating a report in Power BI Desktop. You load a da...
- Question 154: You publish a dataset to the Power BI service. The dataset c...
- Question 155: You have a Power Bl report hosted on powerbi.com that displa...
- Question 156: You create a Power BI workspace named Workspace1. You publis...
- Question 157: Drag and Drop Question You have a folder that contains 100 C...
- Question 158: You have the visual shown in the exhibit. (Exhibit) You need...
- Question 159: You build a report to help the sales team understand its per...
- Question 160: Hotspot Question You use Power Query Editor to preview the d...
- Question 161: Case Study 3 - Northwind Traders Overview. General Overview ...
- Question 162: You are creating a visual to show the ranking of product cat...
- Question 163: You plan to create a dashboard in the Power BI service that ...
- Question 164: Hotspot Question You are building a financial report by usin...
- Question 165: Note: This question is part of a series of questions that pr...
- Question 166: You are developing a report page. Some users will navigate t...
- Question 167: You have a dataset that is used infrequently and refreshes e...
- Question 168: You use Power Query Editor to import and preview sales data ...
- Question 169: You have an Azure SQL database that contains sales transacti...
- Question 170: Case Study 1 - Litware, Inc. Overview Litware, Inc. is an on...
- Question 171: You have a Power BI model that contains the following data. ...
- Question 172: You are creating a sales report in Power Bl for the NorthWes...
- Question 173: Case Study 2 - Contoso Ltd Overview Existing Environment Con...
- Question 174: Hotspot Question You are creating a Microsoft Power BI impor...
- Question 175: Case Study 1 - Litware, Inc. Overview Litware, Inc. is an on...
- Question 176: You have a PBiX file that imports several tables from an Azu...
- Question 177: Drag and Drop Question You build a report about warehouse in...
- Question 178: You have a Microsoft SharePoint Online site that contains se...
- Question 179: Your company has employees in 10 states. The company recentl...
- Question 180: Case Study 2 - Contoso Ltd Overview Existing Environment Con...
- Question 181: You create a dataset sourced from dozens of flat files in Az...
- Question 182: Hotspot Question You have a Power BI semantic model that con...
- Question 183: Hotspot Question You have a Power BI semantic model named Mo...
- Question 184: You have the CSV file shown in the following table. (Exhibit...
- Question 185: Hotspot Question You are profiling data by using Power Query...
- Question 186: You plan to use Power BI Desktop to create a bug tracking da...
- Question 187: You are building a Power B1 report to analyze customer segme...
- Question 188: You have a Power BI semantic model named Model1 that runs in...
- Question 189: Note: This question is part of a series of questions that us...
- Question 190: Hotspot Question You are creating a Microsoft Power Bl model...
- Question 191: Hotspot Question You have a Power BI data model that contain...
- Question 192: Note: This question is part of a series of questions that pr...
- Question 193: You have a collection of reports for the HR department of yo...
- Question 194: You have a Power BI workspace named BI Data that contains a ...
- Question 195: You are building a Power Bl report that uses data from an Az...
- Question 196: You plan to use Power BI to create sales invoices for custom...
- Question 197: You have a Power BI dashboard that monitors the quality of m...
- Question 198: You use Power Query Editor to preview a column named Date as...
- Question 199: Hotspot Question You have two Power BI workspaces named Work...
- Question 200: Hotspot Question You are creating a line chart in a Power BI...
- Question 201: Note: This question is part of a series of questions that pr...
- Question 202: Note: This question is part of a series of questions that pr...
- Question 203: You have a Microsoft SharePoint Online site that contains se...
- Question 204: You have the dashboard shown in the following exhibit. (Exhi...
- Question 205: Hotspot Question You are profiling data by using Power Query...
- Question 206: You have a Microsoft Power BI Desktop report named Report1 t...
- Question 207: You have more than 100 published datasets. Ten of the datase...
- Question 208: Hotspot Question You have the Azure SQL databases shown in t...
- Question 209: Note: This question is part of a series of questions that us...
- Question 210: You have a CSV file that contains user complaints. The file ...
- Question 211: Drag and Drop Question You have a Power BI table named Custo...
- Question 212: Hotspot Question You use Power Query Editor to preview the d...
- Question 213: You have a Power BI semantic model that connects to a stream...
- Question 214: Drag and Drop Question You are creating a Power Bi model and...
- Question 215: You import two Microsoft Excel tables named Customer and Add...
- Question 216: Drag and Drop Question In Power Query Editor, you have three...
- Question 217: Drag and Drop Question You have a Power Bl workspace that co...
- Question 218: You have a custom connector that returns ID, From, To, Subje...
- Question 219: A business intelligence (Bl) developer creates a dataflow in...
- Question 220: Hotspot Question You have a Power BI model that has the foll...
- Question 221: You have sales data in a star schema that contains four tabl...
- Question 222: Case Study 3 - Northwind Traders Overview. General Overview ...
- Question 223: Drag and Drop Question You have a query named Customer that ...
