<< Prev Question Next Question >>
Question 21/29
A technical architect is provided with the logic and Opportunity file shown below:
The opportunity status logic is as follows:
For the opportunity stages "Interest", "Confirmed Interest" and "Registered", the status should be "Open".
For the opportunity stage "Closed", the opportunity status should be closed.
Otherwise, return null for the opportunity status.
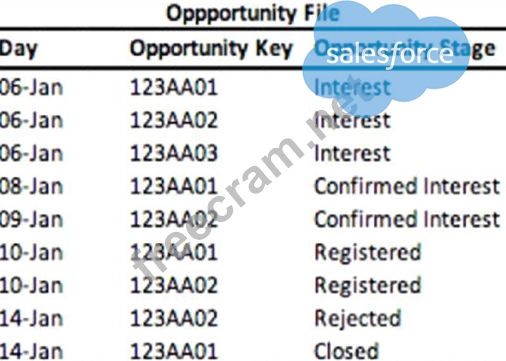
Given the above file and logic and assuming that the file is mapped in a GENERIC data stream type with the following mapping:
"Day" - Standard "Day" field
"Opportunity Key" > Main Generic Entity Key
"Opportunity Stage" - Generic Entity Key 2
"Opportunity Count" - Generic Custom Metric
A pivot table was created to present the count of opportunities in each stage. The pivot table is filtered on Jan
7th - 10th. How many different stages are presented in the table?
The opportunity status logic is as follows:
For the opportunity stages "Interest", "Confirmed Interest" and "Registered", the status should be "Open".
For the opportunity stage "Closed", the opportunity status should be closed.
Otherwise, return null for the opportunity status.
Given the above file and logic and assuming that the file is mapped in a GENERIC data stream type with the following mapping:
"Day" - Standard "Day" field
"Opportunity Key" > Main Generic Entity Key
"Opportunity Stage" - Generic Entity Key 2
"Opportunity Count" - Generic Custom Metric
A pivot table was created to present the count of opportunities in each stage. The pivot table is filtered on Jan
7th - 10th. How many different stages are presented in the table?


