- Home
- Salesforce
- Salesforce Certified CRM Analytics and Einstein Discovery Consultant
- Salesforce.CRM-Analytics-and-Einstein-Discovery-Consultant.v2024-12-23.q55
- Question 50
Valid CRM-Analytics-and-Einstein-Discovery-Consultant Dumps shared by ExamDiscuss.com for Helping Passing CRM-Analytics-and-Einstein-Discovery-Consultant Exam! ExamDiscuss.com now offer the newest CRM-Analytics-and-Einstein-Discovery-Consultant exam dumps, the ExamDiscuss.com CRM-Analytics-and-Einstein-Discovery-Consultant exam questions have been updated and answers have been corrected get the newest ExamDiscuss.com CRM-Analytics-and-Einstein-Discovery-Consultant dumps with Test Engine here:
Access CRM-Analytics-and-Einstein-Discovery-Consultant Dumps Premium Version
(117 Q&As Dumps, 35%OFF Special Discount Code: freecram)
<< Prev Question Next Question >>
Question 50/55
A company wants to create a timeline chart to visualize the evolution of its Closed Won opportunities.
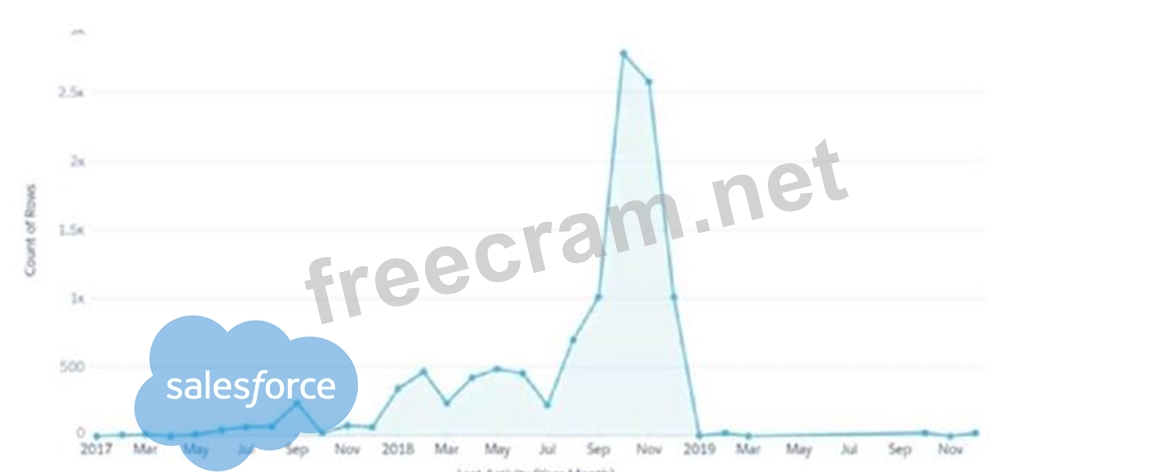
What are the required parameters to build a lens that displays output similar to the image shown?
What are the required parameters to build a lens that displays output similar to the image shown?
Correct Answer: C
To create a timeline chart similar to the one shown, the following parameters are typically required:
1 Measure: This could be the count of Closed Won opportunities or any other relevant metric that needs to be tracked over time.
1 Grouping by a Date Field: This is essential to plot the timeline effectively. The date field would typically be the close date of the opportunities.
Additional Groupings: Depending on the complexity and the detail needed, additional groupings can be added. For example, grouping by region or product line can provide more insights into the timeline. If trellis is used, it allows for the creation of multiple smaller charts within the main chart, each representing a slice of data based on the additional groupings.
This setup helps visualize the evolution of Closed Won opportunities over time, making it easy to spot trends, seasonal patterns, or other relevant insights.


- Question List (55q)
- Question 1: Cloud Kicks (CK) wants to use CRM Analytics to analyze trend...
- Question 2: A CRM Analytics consultant has prepared a CSV file to be upl...
- Question 3: An CRM Analytics consultant creates a model to maximize the ...
- 1 commentQuestion 4: A client has two datasets that are used across seven differe...
- 3 commentQuestion 5: A CRM Analytics consultant has been tasked with providing ac...
- Question 6: Which recommended technique should a CRM Analytics consultan...
- Question 7: Exhibit. (Exhibit) Universal Containers has a dashboard for ...
- Question 8: A CRM Analytics consultant is performing column profiling on...
- Question 9: What are various ways to incorporate blank space in a CRM An...
- Question 10: A company realizes it has a lot of rich information around i...
- Question 11: The sole manager of a CRM Analytics app at Cloud Kicks is le...
- Question 12: A consultant is building a CRM Analytics dashboard for Unive...
- Question 13: A manager at Cloud Kicks wants to separate and analyze accou...
- Question 14: Universal Containers (UC) recently activated data sync in th...
- Question 15: A system administrator and a CRM Analytics consultant are wo...
- Question 16: The administrator at Cloud Kicks has been asked to sync data...
- Question 17: Universal Containers is setting up a Sales Analytics app to ...
- Question 18: A CRM Analytics consultant is reviewing results from an Eins...
- Question 19: Universal Containers (UC) builds three Einstein Discovery mo...
- Question 20: Universal Containers (UC) is looking to create a dashboard f...
- Question 21: A consultant runs the sharing inheritance coverage assessmen...
- Question 22: Which capability can a consultant use if "Deploy without con...
- 1 commentQuestion 23: In a dataset, there are multiple boolean fields. When displa...
- 1 commentQuestion 24: A consultant sets up a Sales Analytics templated app that is...
- 1 commentQuestion 25: CRM Analytics team is asked to build a Service Analytics das...
- 1 commentQuestion 26: The CRM Analytics consultant at Cloud Kicks (CK) notices tha...
- 2 commentQuestion 27: What is the purpose of the CRM Analytics Dashboard Inspector...
- Question 28: The CRM Analytics consultant at Universal Containers has set...
- Question 29: A CRM Analytics consultant wants to move a dataflow to a rec...
- Question 30: A system administrator at Cloud Kicks creates a joined repor...
- Question 31: A CRM Analytics consultant at Cloud Kicks is trying to uploa...
- Question 32: A consultant wants to understand what the important predicto...
- Question 33: Universal Containers (UC) has a "Sales Manager" dashboard. U...
- Question 34: Universal Containers has a single dataset that contains the ...
- 1 commentQuestion 35: Universal Containers has a dashboard for sales managers. The...
- Question 36: Universal Containers (UC) uses a Microsoft Azure SQL Data Wa...
- Question 37: A new picklist value was added for the Category field on the...
- Question 38: A team of CRM Analytics developers has been working on an ex...
- 2 commentQuestion 39: CRM Analytics team plans to enable data sync. Which limit sp...
- 1 commentQuestion 40: Cloud Kicks' Salesforce org has multiple currencies enabled....
- Question 41: A CRM Analytics consultant has been asked to add a custom ob...
- Question 42: A CRM Analytics consultant is asked to make changes to the c...
- Question 43: Universal Containers has a dashboard for sales managers. The...
- Question 44: Cloud Kicks uses CRM Analytics for its sales reporting. A ne...
- Question 45: Universal Containers wants to create two dashboards and has ...
- Question 46: At Universal Containers, a dashboard is built to track sales...
- 1 commentQuestion 47: Universal Containers' sales team is looking to build a dashb...
- Question 48: A dashboard designer at Cloud Kicks creates a dashboard in C...
- Question 49: The CRM Analytics consultant at Universal Containers notices...
- Question 50: A company wants to create a timeline chart to visualize the ...
- Question 51: A CRM Analytics consultant is asked to help a company report...
- Question 52: Universal Containers plans to upload target data from an ext...
- Question 53: Universal Containers (UC) recently activated data sync in th...
- Question 54: What can a consultant accomplish in the Predictions page of ...
- Question 55: The below image shows a numeric outcome being deployed (Regr...

[×]
Download PDF File
Enter your email address to download Salesforce.CRM-Analytics-and-Einstein-Discovery-Consultant.v2024-12-23.q55.pdf