- Home
- MuleSoft
- MuleSoft Certified Integration Architect - Level 1
- MuleSoft.MCIA-Level-1.v2024-10-28.q120
- Question 9
Valid MCIA-Level-1 Dumps shared by EduDump.com for Helping Passing MCIA-Level-1 Exam! EduDump.com now offer the newest MCIA-Level-1 exam dumps, the EduDump.com MCIA-Level-1 exam questions have been updated and answers have been corrected get the newest EduDump.com MCIA-Level-1 dumps with Test Engine here:
Access MCIA-Level-1 Dumps Premium Version
(275 Q&As Dumps, 35%OFF Special Discount Code: freecram)
<< Prev Question Next Question >>
Question 9/120
What metrics about API invocations are available for visualization in custom charts using Anypoint Analytics?
Correct Answer: C
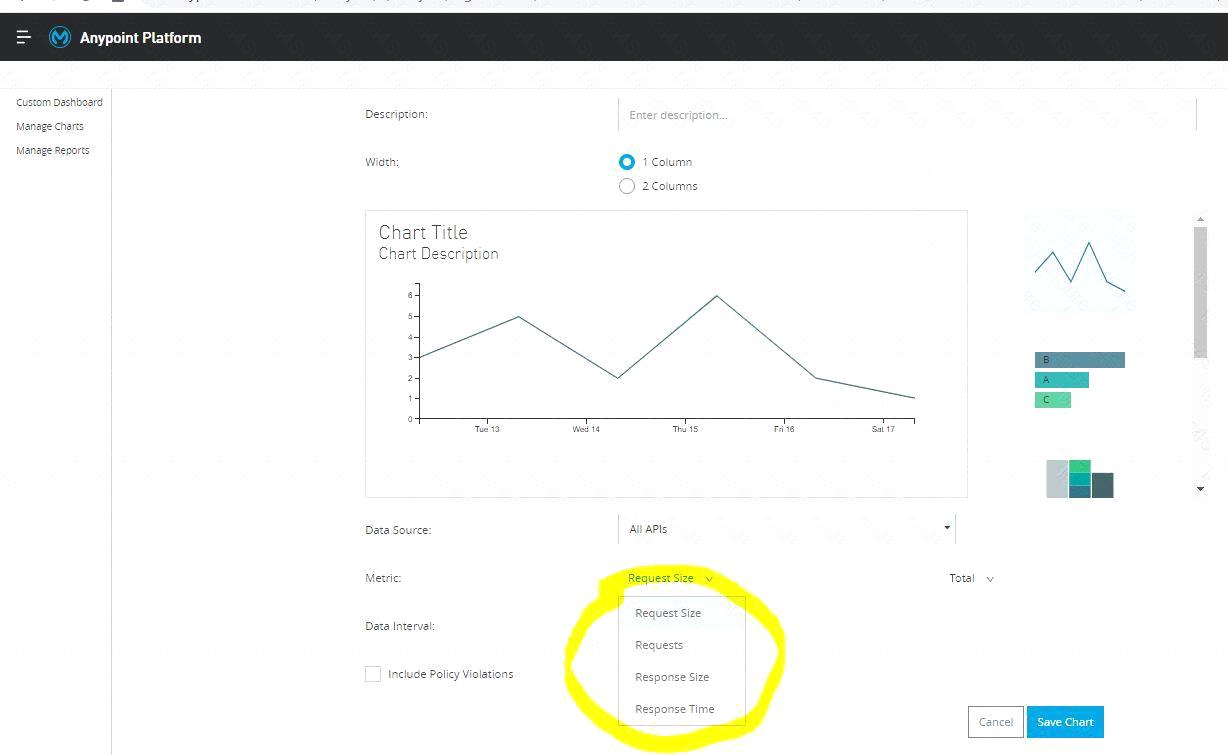
Correct answer is Request size, number of requests, response size, response time Analytics API Analytics can provide insight into how your APIs are being used and how they are performing. From API Manager, you can access the Analytics dashboard, create a custom dashboard, create and manage charts, and create reports. From API Manager, you can get following types of analytics: - API viewing analytics - API events analytics - Charted metrics in API Manager It can be accessed using: http://anypoint.mulesoft.com/analytics API Analytics provides a summary in chart form of requests, top apps, and latency for a particular duration.
The custom dashboard in Anypoint Analytics contains a set of charts for a single API or for all APIs Each chart displays various API characteristics
- Requests size: Line chart representing size of requests in KBs
- Requests : Line chart representing number of requests over a period
- Response size : Line chart representing size of response in KBs
- Response time :Line chart representing response time in ms
* To check this, You can go to API Manager > Analytics > Custom Dashboard > Edit Dashboard > Create Chart > Metric Graphical user interface, chart Description automatically generated


- Question List (120q)
- Question 1: When designing an upstream API and its implementation, the d...
- Question 2: An organization's security policies mandate complete control...
- Question 3: An organization is creating a set of new services that are c...
- Question 4: An organization has various integrations implemented as Mule...
- Question 5: A mule application is being designed to perform product orch...
- Question 6: A team has completed the build and test activities for a Mul...
- 1 commentQuestion 7: Anypoint Exchange is required to maintain the source code of...
- Question 8: An automation engineer needs to write scripts to automate th...
- Question 9: What metrics about API invocations are available for visuali...
- Question 10: A leading eCommerce giant will use MuleSoft APIs on Runtime ...
- Question 11: Refer to the exhibit. (Exhibit) What is the type data format...
- Question 12: A Mule application uses the Database connector. What conditi...
- Question 13: A payment processing company has implemented a Payment Proce...
- Question 14: A rale limiting policy has been applied to a soap VI.2 API p...
- Question 15: What is a core pillar of the MuleSoft Catalyst delivery appr...
- 1 commentQuestion 16: An organization has implemented a continuous integration (CI...
- 1 commentQuestion 17: A marketing organization is designing a Mule application to ...
- Question 18: Refer to the exhibit. (Exhibit) An organization is sizing an...
- Question 19: What is not true about Mule Domain Project?...
- 2 commentQuestion 20: An application deployed to a runtime fabric environment with...
- Question 21: As a part of project requirement, client will send a stream ...
- Question 22: A team would like to create a project skeleton that develope...
- 1 commentQuestion 23: A mule application must periodically process a large dataset...
- Question 24: An organization has an HTTPS-enabled Mule application named ...
- Question 25: A company is designing an integration Mule application to pr...
- Question 26: A manufacturing company is planning to deploy Mule applicati...
- 1 commentQuestion 27: Refer to the exhibit. (Exhibit) A Mule application is deploy...
- Question 28: Which Exchange asset type represents a complete API specific...
- Question 29: A mule application designed to fulfil two requirements a) Pr...
- Question 30: What is a defining characteristic of an integration-Platform...
- Question 31: A project team is working on an API implementation using the...
- 2 commentQuestion 32: An organization is designing multiple new applications to ru...
- Question 33: The retrieveBalances flow in the Mule application is designe...
- Question 34: Organization wants to achieve high availability goal for Mul...
- Question 35: An organization will deploy Mule applications to Cloudhub, B...
- 1 commentQuestion 36: A leading bank implementing new mule API. The purpose of API...
- Question 37: Refer to the exhibit. (Exhibit) One of the backend systems i...
- Question 38: An API has been unit tested and is ready for integration tes...
- Question 39: A stock broking company makes use of CloudHub VPC to deploy ...
- Question 40: The AnyAirline organization's passenger reservations center ...
- Question 41: An insurance company is using a CIoudHub runtime plane. As a...
- Question 42: Following MuleSoft best practices, what MuleSoft runtime dep...
- 1 commentQuestion 43: An organization plans to migrate all its Mule applications t...
- Question 44: An integration team uses Anypoint Platform and follows MuleS...
- Question 45: A global organization operates datacenters in many countries...
- Question 46: An organization is designing a mule application to support a...
- Question 47: Mule applications need to be deployed to CloudHub so they ca...
- Question 48: A Mule application contains a Batch Job scope with several B...
- Question 49: An airline is architecting an API connectivity project to in...
- Question 50: Refer to the exhibit. (Exhibit) An organization deploys mult...
- Question 51: A Mule application contains a Batch Job with two Batch Steps...
- Question 52: How does timeout attribute help inform design decisions whil...
- Question 53: What aspects of a CI/CD pipeline for Mule applications can b...
- Question 54: An organization has strict unit test requirement that mandat...
- Question 55: A global, high-volume shopping Mule application is being bui...
- Question 56: According to the National Institute of Standards and Technol...
- Question 57: A REST API is being designed to implement a Mule application...
- 1 commentQuestion 58: An organization is migrating all its Mule applications to Ru...
- Question 59: An organization is designing an integration Mule application...
- Question 60: An organization is building a test suite for their applicati...
- Question 61: An organization is evaluating using the CloudHub shared Load...
- Question 62: Which Salesforce API is invoked to deploy, retrieve, create ...
- Question 63: What approach configures an API gateway to hide sensitive da...
- Question 64: What is required before an API implemented using the compone...
- Question 65: The implementation of a Process API must change. What is a v...
- Question 66: An organization plans to extend its Mule APIs to the EU (Fra...
- Question 67: A stock trading company handles millions of trades a day and...
- Question 68: Refer to the exhibit. (Exhibit) A Mule 4 application has a p...
- Question 69: An organization is successfully using API led connectivity, ...
- Question 70: An organization if struggling frequent plugin version upgrad...
- Question 71: An organization plans to migrate its deployment environment ...
- Question 72: A high-volume eCommerce retailer receives thousands of order...
- Question 73: An organization's IT team must secure all of the internal AP...
- Question 74: An organization has chosen Mulesoft for their integration an...
- Question 75: A company is building an application network and has deploye...
- Question 76: A trading company handles millions of requests a day. Due to...
- Question 77: An organization is using Mulesoft cloudhub and develops API'...
- Question 78: Mule application is deployed to Customer Hosted Runtime. Asy...
- Question 79: An API client is implemented as a Mule application that incl...
- Question 80: An integration Mule application is deployed to a customer-ho...
- Question 81: An organization is creating a Mule application that will be ...
- Question 82: 49 of A popular retailer is designing a public API for its n...
- Question 83: A mule application is required to periodically process large...
- Question 84: A Mule application is being designed for deployment to a sin...
- Question 85: Customer has deployed mule applications to different custome...
- Question 86: A Mule application is being designed To receive nightly a CS...
- Question 87: When the mule application using VM is deployed to a customer...
- Question 88: What operation can be performed through a JMX agent enabled ...
- Question 89: Refer to the exhibit. (Exhibit) This Mule application is dep...
- Question 90: According to MuleSoft, what Action should an IT organization...
- Question 91: Which Mulesoft feature helps users to delegate their access ...
- Question 92: A retail company is implementing a MuleSoft API to get inven...
- Question 93: An XA transaction Is being configured that involves a JMS co...
- Question 94: Which of the below requirements prevent the usage of Anypoin...
- Question 95: Which component of Anypoint platform belongs to the platform...
- Question 96: A Mule application is built to support a local transaction f...
- Question 97: What are two reasons why a typical MuleSoft customer favors ...
- Question 98: One of the backend systems involved by the API implementatio...
- Question 99: As a part of project requirement, Java Invoke static connect...
- Question 100: An API implementation is being designed that must invoke an ...
- Question 101: To implement predictive maintenance on its machinery equipme...
- Question 102: A project team uses RAML specifications to document API func...
- Question 103: What requirement prevents using Anypoint MQ as the messaging...
- Question 104: What aspect of logging is only possible for Mule application...
- Question 105: The company's FTPS server login username and password...
- Question 106: As a part of design , Mule application is required call the ...
- Question 107: An organization is sizing an Anypoint VPC to extend their in...
- Question 108: In one of the critical payment related mule application, tra...
- Question 109: A set of integration Mule applications, some of which expose...
- Question 110: A Mule application currently writes to two separate SQL Serv...
- Question 111: An organization heeds to procure an enterprise software syst...
- Question 112: An organization plans to use the Anypoint Platform audit log...
- Question 113: An organization is designing an integration solution to repl...
- Question 114: What is true about automating interactions with Anypoint Pla...
- Question 115: What Anypoint Connectors support transactions?...
- Question 116: According to MuleSoft, what is a major distinguishing charac...
- Question 117: As an enterprise architect, what are the two reasons for whi...
- Question 118: Which productivity advantage does Anypoint Platform have to ...
- Question 119: A MuteSoft developer must implement an API as a Mule applica...
- Question 120: Refer to the exhibit. An organization is designing a Mule ap...

[×]
Download PDF File
Enter your email address to download MuleSoft.MCIA-Level-1.v2024-10-28.q120.pdf