Valid DA-100 Dumps shared by ExamDiscuss.com for Helping Passing DA-100 Exam! ExamDiscuss.com now offer the newest DA-100 exam dumps, the ExamDiscuss.com DA-100 exam questions have been updated and answers have been corrected get the newest ExamDiscuss.com DA-100 dumps with Test Engine here:
Access DA-100 Dumps Premium Version
(150 Q&As Dumps, 35%OFF Special Discount Code: freecram)
<< Prev Question Next Question >>
Question 32/49
You plan to create the chart shown in the following exhibit.
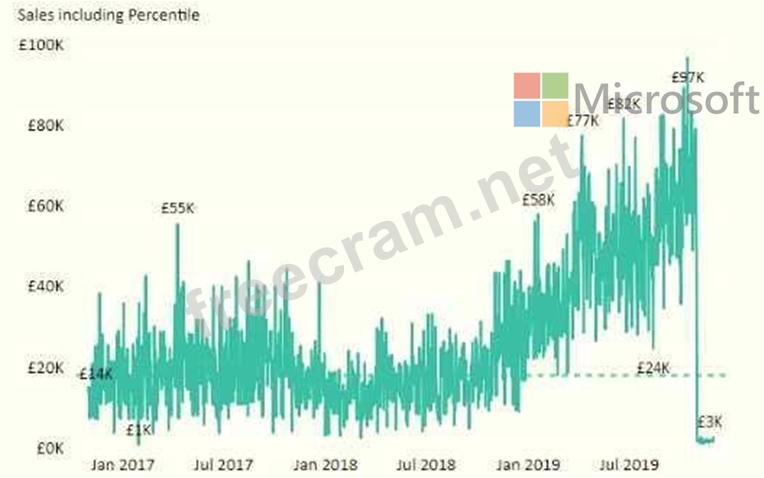
How should you create the dashed horizontal line denoting the 40th percentile of daily sales for the period shown?
How should you create the dashed horizontal line denoting the 40th percentile of daily sales for the period shown?
Correct Answer: D


- Question List (49q)
- Question 1: You are configuring a Microsoft Power Bl data model to enabl...
- Question 2: Note: This question is part of a series of questions that pr...
- Question 3: Hotspot Question You have a table that contains the followin...
- Question 4: You have a Microsoft SharePoint Online site that contains se...
- Question 5: You are developing a report page. Some users will navigate t...
- Question 6: Your company has a security policy stating that proprietary ...
- Question 7: You create a dashboard by using the Microsoft Power Bl Servi...
- Question 8: You have a Microsoft Power BI data model that contains three...
- Question 9: You have a Power BI Desktop project that has the model shown...
- Question 10: Hotspot Question You are creating an analytics report that w...
- Question 11: You attempt to publish a Microsoft Excel file to Power BI, a...
- Question 12: Note: This question is part of a series of questions that pr...
- Question 13: Hotspot Question You need to create a visual as shown in the...
- Question 14: Case Study 1 - Litware, Inc. Overview Litware, Inc. is an on...
- Question 15: You have four sales regions. Each region has multiple sales ...
- Question 16: Note: This question is part of a series of questions that pr...
- Question 17: You have a Microsoft Power Bl report. The size of PBIX file ...
- Question 18: You use an R visual to produce a map of 500,000 customers. Y...
- Question 19: You have sales data in a star schema that contains four tabl...
- Question 20: Case Study 2 - Contoso Ltd Overview Existing Environment Con...
- Question 21: You have a query that returns the data shown in the followin...
- Question 22: Your company plans to completely separate development and pr...
- Question 23: You have a dashboard that contains tiles pinned from a singl...
- Question 24: Note: This question is part of a series of questions that pr...
- Question 25: Case Study 1 - Litware, Inc. Overview Litware, Inc. is an on...
- Question 26: Case Study 1 - Litware, Inc. Overview Litware, Inc. is an on...
- Question 27: Hotspot Question You have two Azure SQL databases that conta...
- Question 28: You create the following step by using Power Query Editor. =...
- Question 29: You have a CSV file that contains user complaints. The file ...
- Question 30: Note: This question is part of a series of questions that pr...
- Question 31: You have a Power BI dataset that contains a table named Temp...
- Question 32: You plan to create the chart shown in the following exhibit....
- Question 33: Case Study 1 - Litware, Inc. Overview Litware, Inc. is an on...
- Question 34: Drag and Drop Question You build a report about warehouse in...
- Question 35: Case Study 1 - Litware, Inc. Overview Litware, Inc. is an on...
- Question 36: You have multiple dashboards. You need to ensure that when u...
- Question 37: You have the following three versions of an Azure SQL databa...
- Question 38: You have a Microsoft Power Bl dashboard. You need to ensure ...
- Question 39: Note: This question is part of a series of questions that pr...
- Question 40: You have a Microsoft Power Bl dashboard. The report used to ...
- Question 41: You are creating a report in Power BI Desktop that has two v...
- 1 commentQuestion 42: From the Home tab in Power BI Desktop, you click Enter Data ...
- 1 commentQuestion 43: You have a Microsoft Power Bl report. The size of PBIX file ...
- 1 commentQuestion 44: You have the following table named Location. (Exhibit) The G...
- 1 commentQuestion 45: Hotspot Question You have a report page that contains the vi...
- 1 commentQuestion 46: You are creating a visual to show the ranking of product cat...
- Question 47: Your company has employees in 10 states. The company recentl...
- Question 48: You have an Azure SQL database that contains sales transacti...
- Question 49: You have a Power BI model for sales data. You create a measu...
