<< Prev Question Next Question >>
Question 3/49
Hotspot Question
You have a table that contains the following three columns:
* City
* Total Sales
* Occupation
You need to create a key influencers visualization as shown in the exhibit. (Click the Exhibit tab.)
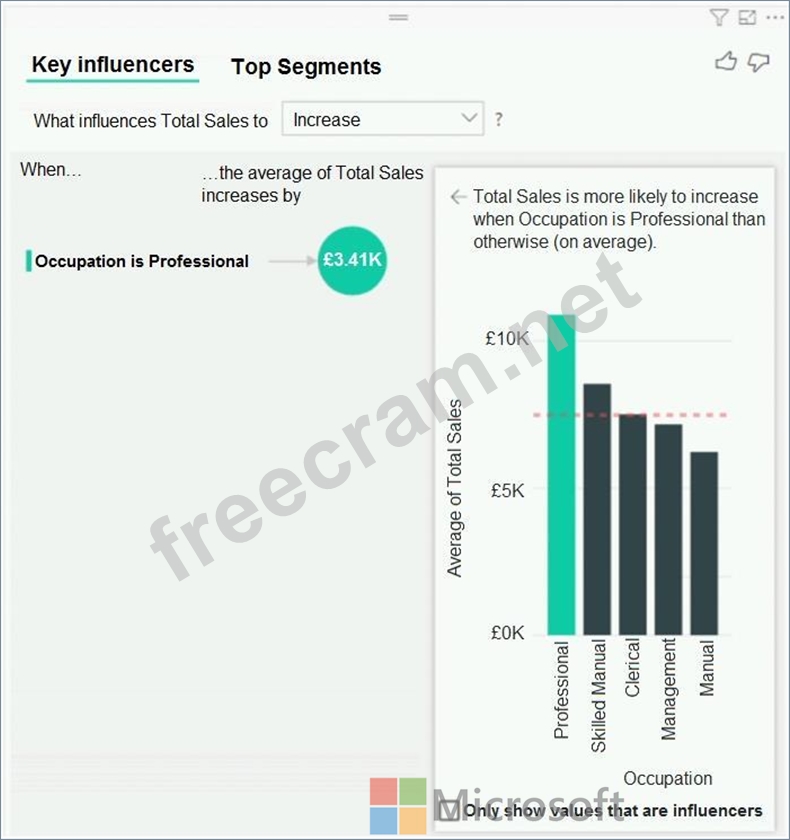
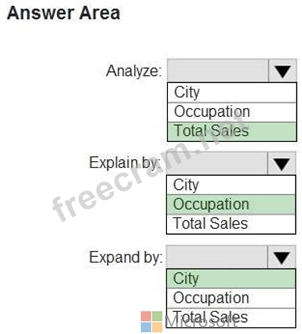
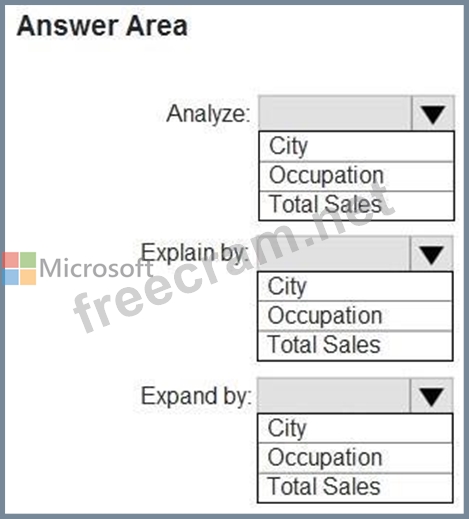
How should you configure the visualization? To answer, select the appropriate options in the answer area.
NOTE: Each correct selection is worth one point.
You have a table that contains the following three columns:
* City
* Total Sales
* Occupation
You need to create a key influencers visualization as shown in the exhibit. (Click the Exhibit tab.)
How should you configure the visualization? To answer, select the appropriate options in the answer area.
NOTE: Each correct selection is worth one point.