<< Prev Question Next Question >>

Question 23/31

Note: This question is part of a series of questions that use the same scenario. For your convenience, the scenario is repeated in each question. Each question presents a different goal and answer choices, but the text of the scenario is the same in each question in this series.
You have a Microsoft SQL Server database that contains the following tables.

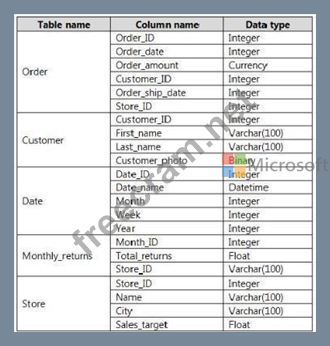
The following columns contain date information:
- Date[Month] in the mmyyyy format
- Date[Date_ID] in the ddmmyyyy format
- Date[Date_name] in the mm/dd/yyyy format
- Monthly_returns[Month_ID] in the mmyyyy format
The Order table contains more than one million rows.
The Store table has a relationship to the Monthly_returns table on the Store_ID column. This is the only relationship between the tables.
You plan to use Power BI Desktop to create an analytics solution for the data.
You are modifying the model to report on the number of orders.
You need to calculate the number of orders.
What should you do?

LEAVE A REPLY

Your email address will not be published. Required fields are marked *

Question List (31q)
Question 1: Case Study 2 - Contoso Ltd Overview Existing Environment Con...
Question 2: You create a dashboard that displays the results of a custom...
Question 3: You have multiple dashboards. You need to ensure that when u...
Question 4: Your company has a security policy stating that proprietary ...
Question 5: Note: This question is part of a series of questions that pr...
Question 6: You create a dashboard by using the Microsoft Power Bl Servi...
Question 7: You have the visual shown in the Original exhibit. (Click th...
1 commentQuestion 8: Drag and Drop Question You have a Microsoft Power Bl workspa...
Question 9: You have a report that contains three pages. One of the page...
Question 10: Note: This question is part of a series of questions that pr...
Question 11: Hotspot Question You need to create a visual as shown in the...
Question 12: Drag and Drop Question You build a report about warehouse in...
1 commentQuestion 13: Hotspot Question You are creating an analytics report that w...
Question 14: You build a report to help the sales team understand its per...
Question 15: You have the visual shown in the exhibit. (Click the Exhibit...
1 commentQuestion 16: Hotspot Question You have a report page that contains the vi...
2 commentQuestion 17: You have the following table named Location. (Exhibit) The G...
Question 18: You create the following step by using Power Query Editor. =...
Question 19: You are creating a visual to show the ranking of product cat...
1 commentQuestion 20: Note: This question is part of a series of questions that us...
1 commentQuestion 21: You have a collection of reports for the HR department of yo...
Question 22: You have a Power BI model for sales data. You create a measu...
Question 23: Note: This question is part of a series of questions that us...
Question 24: Hotspot Question You are creating a Microsoft Power Bl impor...
Question 25: You have a table in Power BI Desktop as shown in the followi...
Question 26: Case Study 2 - Contoso Ltd Overview Existing Environment Con...
Question 27: You have a table that contains sales data and approximately ...
Question 28: You are creating a visual to show the ranking of product cat...
Question 29: You have a report that contains four pages. Each page contai...
1 commentQuestion 30: Case Study 1 - Litware, Inc. Overview Litware, Inc. is an on...
Question 31: Note: This question is part of a series of questions that pr...