<< Prev Question Next Question >>
Question 12/31
Drag and Drop Question
You build a report about warehouse inventory data. The dataset has more than 10 million product records from 200 warehouses worldwide.
You have a table named Products that contains the columns shown in the following table.
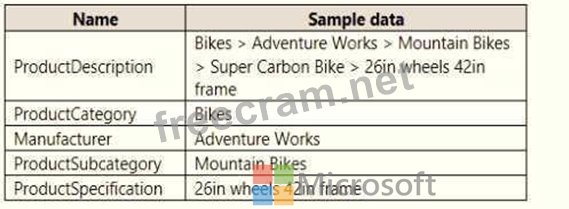
Warehouse managers report that it is difficult to use the report because the report uses only the product name in tables and visuals. The product name is contained within the ProductDescription column and is always the fourth value.
You need to modify the report to support the warehouse managers requirement to explore inventory levels at different levels of the product hierarchy. The solution must minimize the model size.
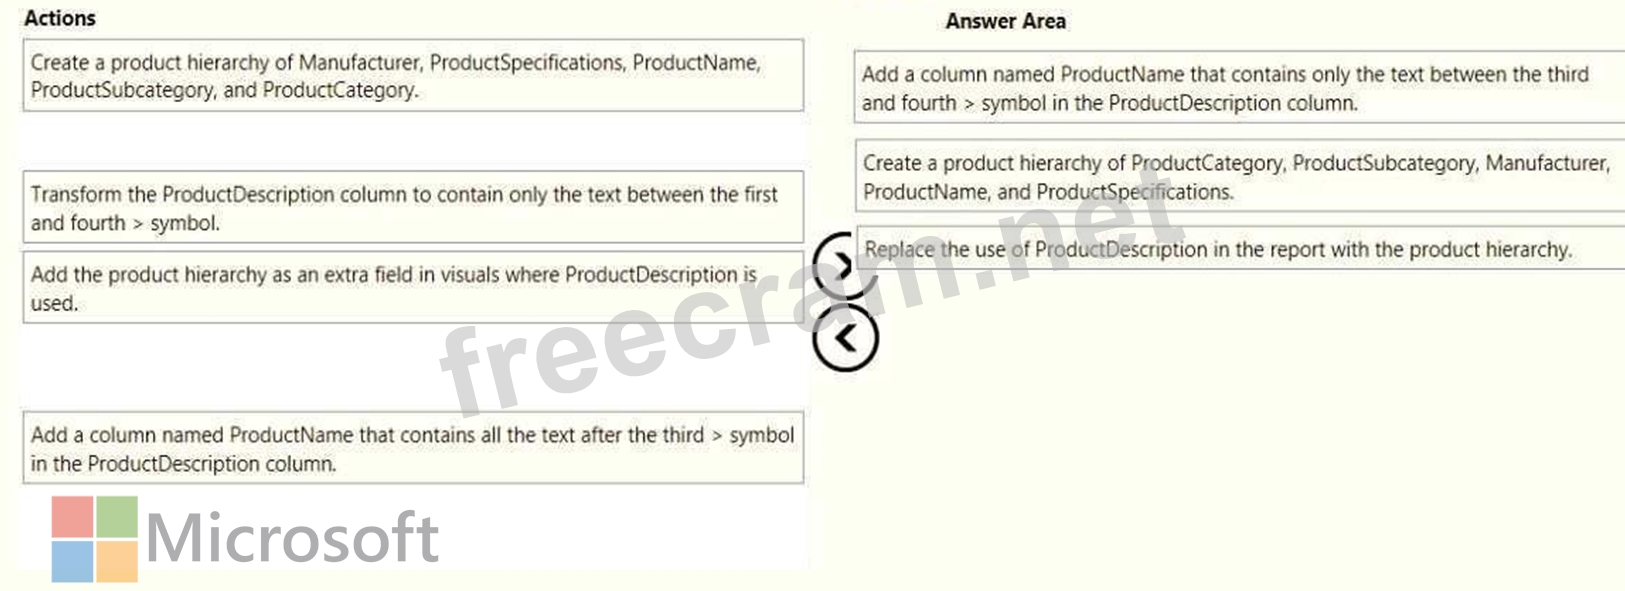
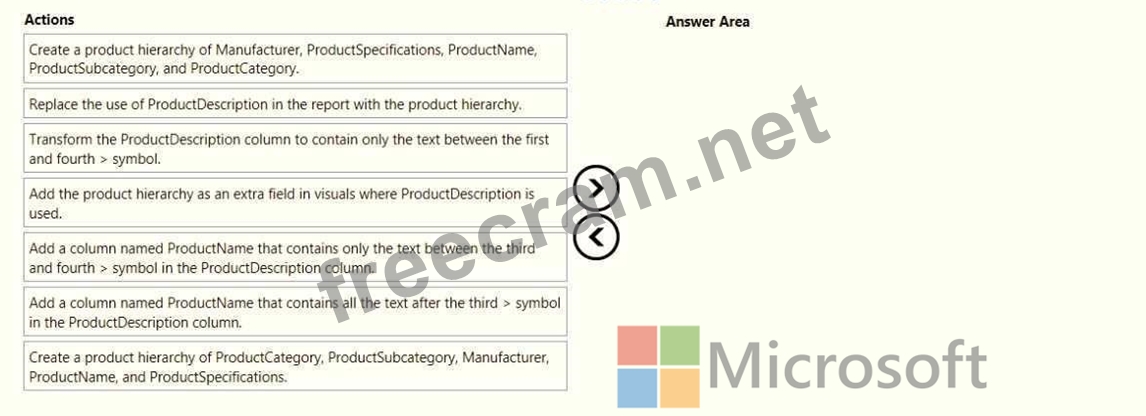
Which three actions should you perform in sequence? To answer, move the appropriate actions from the list of actions to the answer area and arrange them in the correct order.
You build a report about warehouse inventory data. The dataset has more than 10 million product records from 200 warehouses worldwide.
You have a table named Products that contains the columns shown in the following table.
Warehouse managers report that it is difficult to use the report because the report uses only the product name in tables and visuals. The product name is contained within the ProductDescription column and is always the fourth value.
You need to modify the report to support the warehouse managers requirement to explore inventory levels at different levels of the product hierarchy. The solution must minimize the model size.
Which three actions should you perform in sequence? To answer, move the appropriate actions from the list of actions to the answer area and arrange them in the correct order.