Valid TDA-C01 Dumps shared by ExamDiscuss.com for Helping Passing TDA-C01 Exam! ExamDiscuss.com now offer the newest TDA-C01 exam dumps, the ExamDiscuss.com TDA-C01 exam questions have been updated and answers have been corrected get the newest ExamDiscuss.com TDA-C01 dumps with Test Engine here:
Access TDA-C01 Dumps Premium Version
(178 Q&As Dumps, 35%OFF Special Discount Code: freecram)
<< Prev Question Next Question >>
Question 11/45
Open the link to Book1 found on the desktop. Open SalesVSProfit worksheet.
Add a distribution band on Profit to show the standard deviation from- 1 to 1.
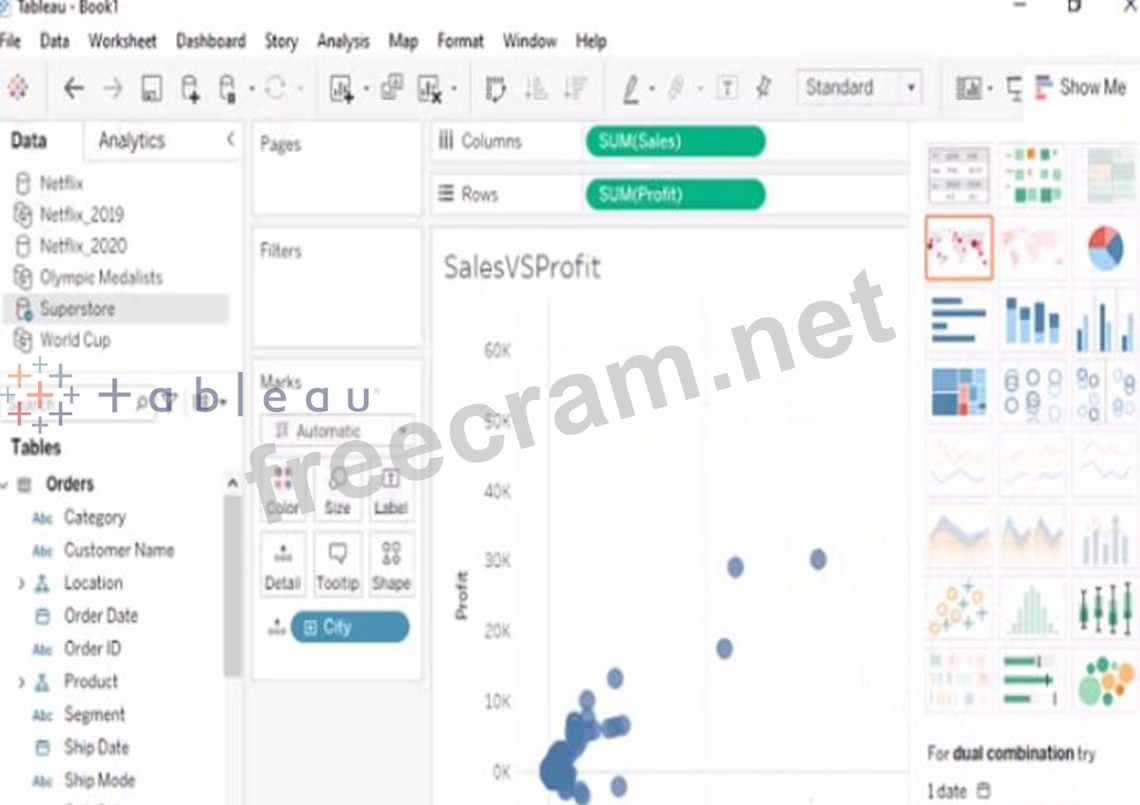
Add a distribution band on Profit to show the standard deviation from- 1 to 1.
Correct Answer: A
To add a distribution band on Profit to show the standard deviation from -1 to 1, you need to do the following steps:
Open the link to Book1 found on the desktop. This will open the Tableau workbook that contains the SalesVSProfit worksheet.
Click on the SalesVSProfit tab at the bottom of the workbook to open the worksheet. You will see a scatter plot that shows the relationship between Sales and Profit for each Sub-Category.
Click on the Analytics tab on the left side of the workbook to open the Analytics pane. You will see a list of analytical objects that you can drag and drop onto your worksheet.
Drag Distribution Band from the Analytics pane to Profit on the Rows shelf. This will add a distribution band on Profit that shows the average and confidence interval for each Sub-Category.
Click on the Edit button on the distribution band to open the Edit Distribution Band dialog box. You will see options to customize your distribution band.
Change the Band From value to -1 and the Band To value to 1. This will change the distribution band to show the standard deviation from -1 to 1, which means one standard deviation below and above the average.
Click OK to apply the changes. You will see that the distribution band now shows a narrower range of values for Profit.


- Question List (45q)
- Question 1: You have the following dataset: (Exhibit) Which grouping opt...
- Question 2: You need to change the values of a dimension without creatin...
- Question 3: You have the Mowing two tables that contains data about the ...
- Question 4: You connect to a database server by using Tableau Prep. The ...
- Question 5: You have the following box plot that shows the distribution ...
- Question 6: You have the following tiled dashboard that has one sheet. (...
- Question 7: You have the following dashboard. (Exhibit) When a user sele...
- Question 8: You have the following chart that shows the cumulative of sa...
- Question 9: You have a blank dashboard. You want to add two sheets to th...
- Question 10: You publish a dashboard tut uses an attract. The extract ref...
- Question 11: Open the link to Book1 found on the desktop. Open SalesVSPro...
- Question 12: You company has two divisions located in the United States a...
- Question 13: You have the following chart that shows profits and discount...
- Question 14: You have a database that includes field named sales, City an...
- Question 15: You have the following tiled dashboard that has one sheet. (...
- Question 16: You have the following dataset in Microsoft Excel. (Exhibit)...
- Question 17: You have the Mowing dashboard. (Exhibit) Which two elements ...
- Question 18: You have the following dataset. (Exhibit) Which grouping opt...
- Question 19: A colleague provides you with access to a folder that contai...
- Question 20: You have a data source that contains data tor every city in ...
- Question 21: You have the following dashboard that contains two sheets. (...
- Question 22: You have the following dataset (Exhibit) You need to create ...
- Question 23: You have a Tableau workbook. You want to make the workbook a...
- Question 24: You want to connect a Tableau workbook to a dataset in a Mic...
- Question 25: You have a dataset that contains sates dat a. The following ...
- Question 26: You have a dataset that contains daily sales by business seg...
- Question 27: Open the link to Book1 found on the desktop. Open the Catego...
- Question 28: You have a data set that contains three columns named Sales,...
- Question 29: You have the following dataset. (Exhibit) Which Level of Det...
- Question 30: You conned to a Microsoft SQL Server database You need to cr...
- Question 31: You have the following visualization. (Exhibit) The Last() c...
- Question 32: Open the link to Book1 found on the desktop. Open the sales ...
- Question 33: You have the following dashboard that contains two visualiza...
- Question 34: You have two data sources that use the same schema One data ...
- Question 35: You have a line chart on a worksheet. You want to add a comm...
- Question 36: You have the following bar chart. (Exhibit) You want the cha...
- Question 37: You have a Tableau Prep flow that joins a dataset named Glob...
- Question 38: Open the link to Book1 found on the desktop. Open the Line w...
- Question 39: You have the following dataset. (Exhibit) You want to create...
- Question 40: You have the following dataset: (Exhibit) You want to create...
- Question 41: You have the following primary data source that contains a d...
- Question 42: You create a parameter named Choose Region fiat contains val...
- Question 43: You have the following two datasets: * A Microsoft Excel wor...
- Question 44: From Tableau Desktop you sign in lo a Tableau Server site. W...
- Question 45: You are subscribed to several views. You need to unsubscribe...
