Valid TCC-C01 Dumps shared by ExamDiscuss.com for Helping Passing TCC-C01 Exam! ExamDiscuss.com now offer the newest TCC-C01 exam dumps, the ExamDiscuss.com TCC-C01 exam questions have been updated and answers have been corrected get the newest ExamDiscuss.com TCC-C01 dumps with Test Engine here:
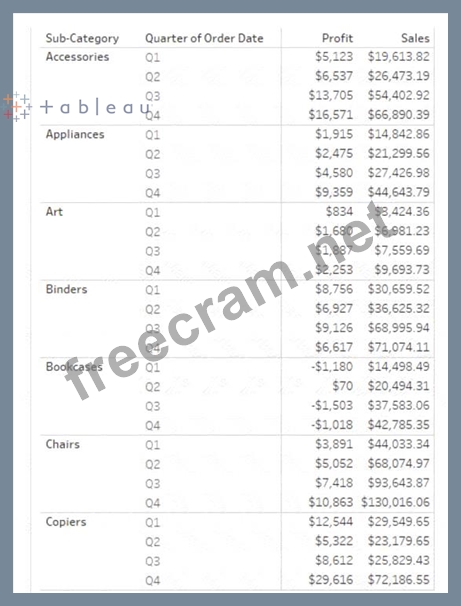
A client wants to produce a visualization to show quarterly profit growth and aggregated sales totals across a number of product categories from the data provided below. Which set of charts should the consultant use to meet the client's requirements?
Correct Answer: B
To effectively display quarterly profit growth and aggregated sales totals across different product categories, a combination of a Waterfall chart and a Tree Map is recommended: * Waterfall Chart: This chart type is excellent for visualizing the sequential growth or decline of profits across different quarters for each sub-category. It clearly shows how profits accumulate over time, highlighting both positive and negative changes, which makes it ideal for tracking profit growth or decline through the quarters. * Tree Map: A Tree Map can efficiently display aggregated sales totals where each block size represents the total sales of a product category, providing a quick, visually impactful comparison across categories. This is especially useful when the client wants to understand which categories contribute most to sales in a glanceable format. Together, these charts provide a comprehensive overview of both profit trends over time (Waterfall Chart) and a comparative snapshot of sales performance across categories (Tree Map), meeting the client's need to analyze performance dynamics in a detailed yet consolidated manner. ReferencesThese recommendations are based on common best practices for data visualization in Tableau, where specific chart types are chosen for their strengths in communicating certain types of data relationships and dynamics, as detailed in Tableau's official visualization guides.