<< Prev Question Next Question >>
Question 5/38
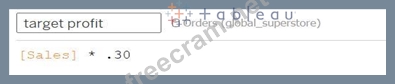
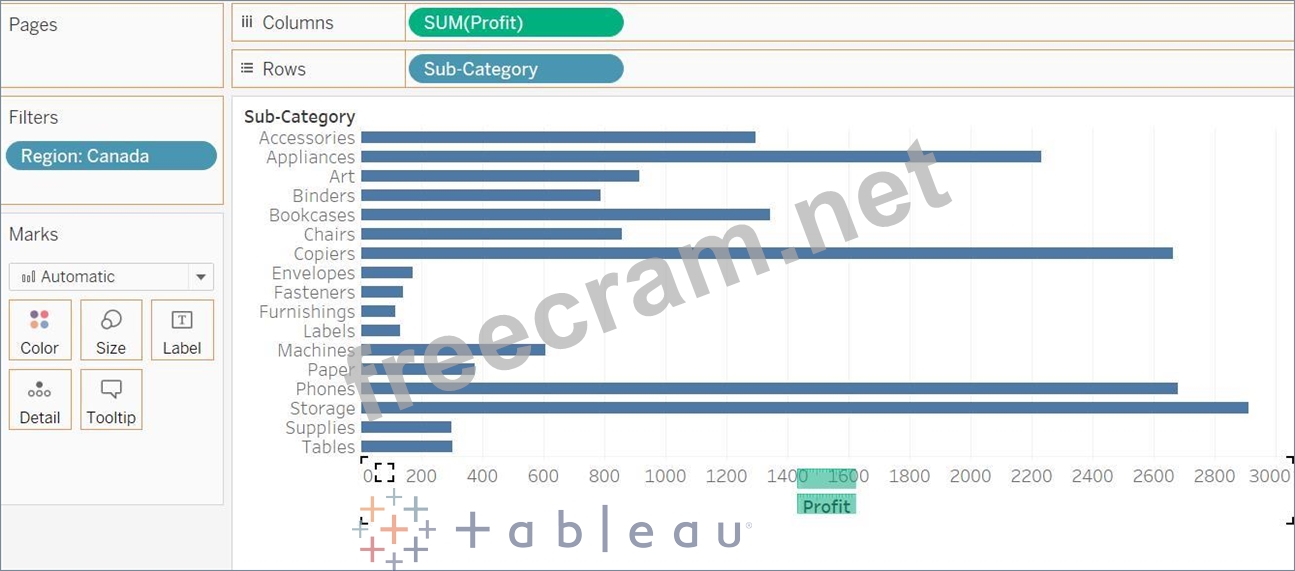
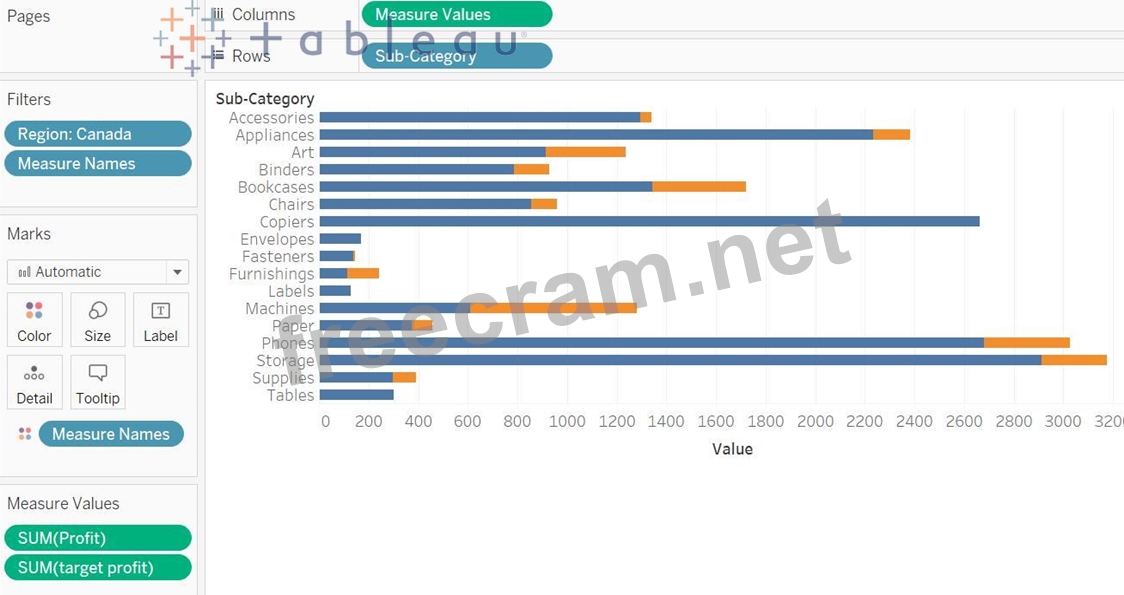
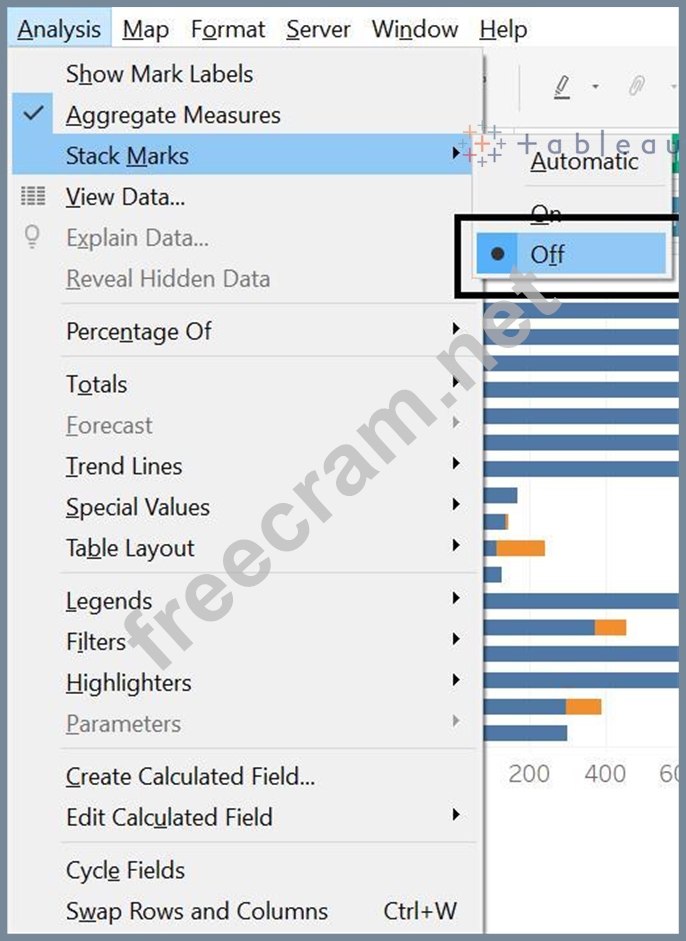
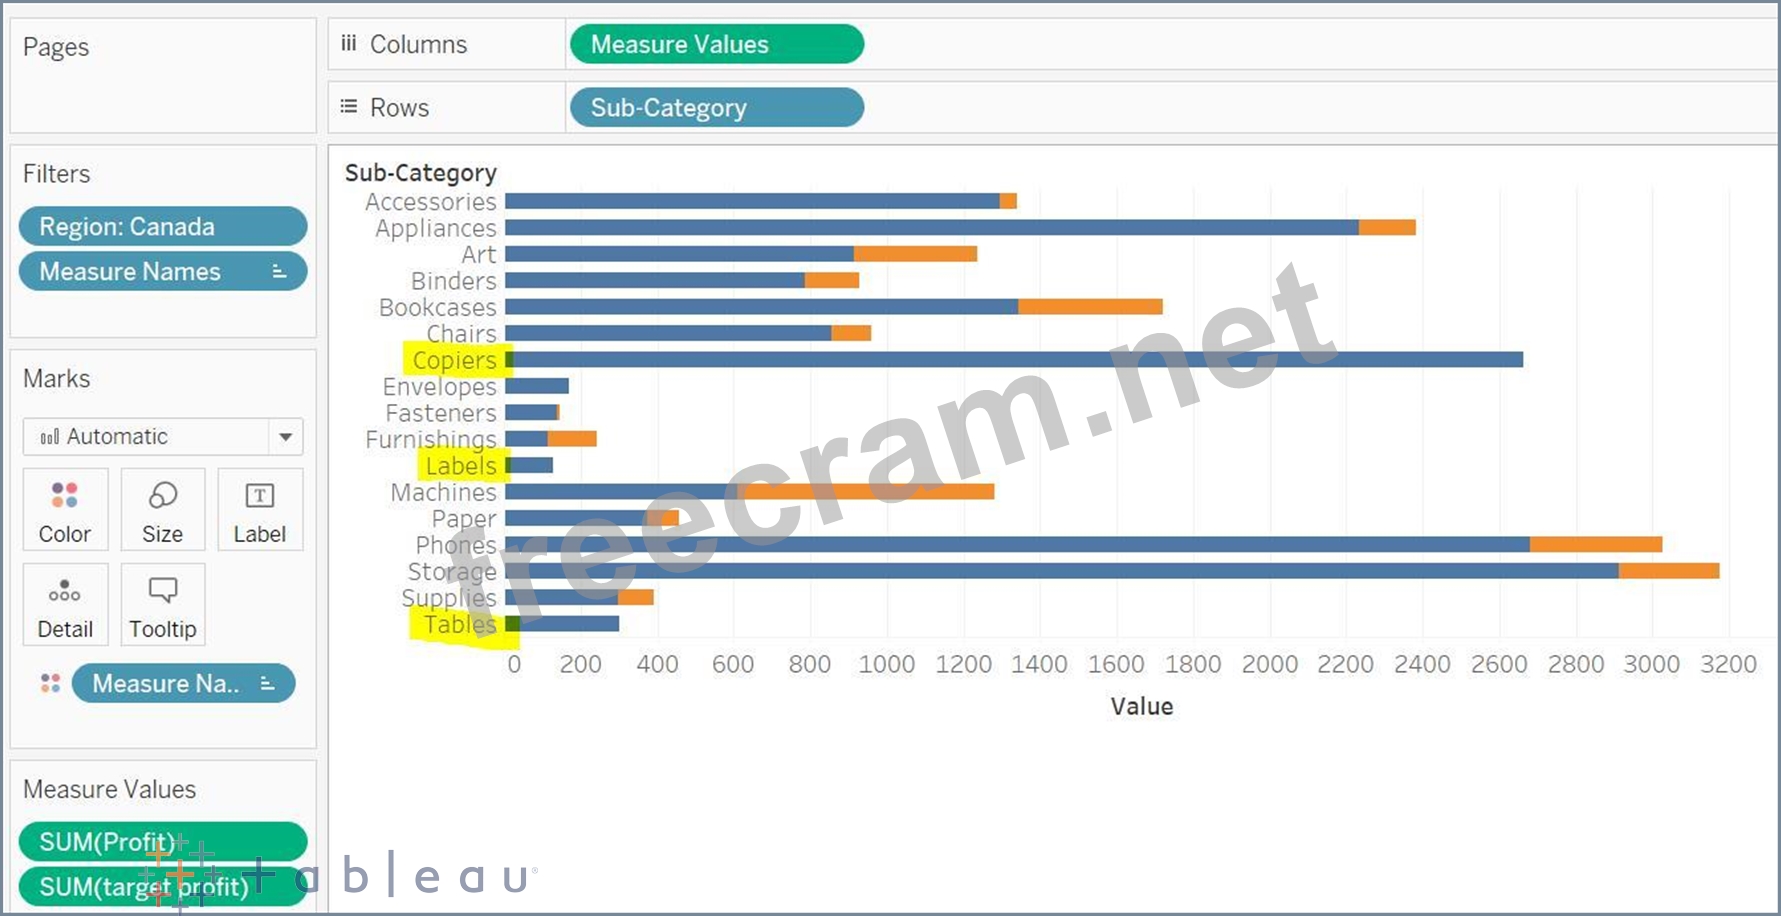
Connect to the "Global Superstore" data source and use the Orders table. Create a bar in bar chart and compare the profit against the target profit for Canada Region. Consider target profit is 30% of the sales. Which of the following sub-categories has met or exceed the target profit?