<< Prev Question Next Question >>
Question 22/29
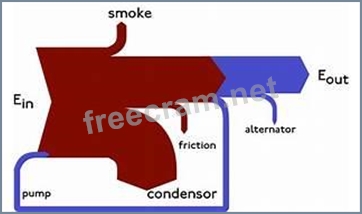
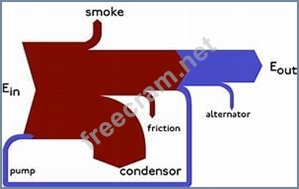
Your CISO asks that you to provide a report with a visual representation of the top 10 applications (by number of objects) and their risk score. As the administrator, you decide to use a Sankey visualization in Advanced Analytics to represent the data in an efficient manner.
In this scenario, which two field types are required to produce a Sankey Tile in your report? {Choose two.)
In this scenario, which two field types are required to produce a Sankey Tile in your report? {Choose two.)


