- Home
- Microsoft
- Implementing Analytics Solutions Using Microsoft Fabric
- Microsoft.DP-600.v2025-12-15.q58
- Question 43
Valid DP-600 Dumps shared by EduDump.com for Helping Passing DP-600 Exam! EduDump.com now offer the newest DP-600 exam dumps, the EduDump.com DP-600 exam questions have been updated and answers have been corrected get the newest EduDump.com DP-600 dumps with Test Engine here:
Access DP-600 Dumps Premium Version
(194 Q&As Dumps, 35%OFF Special Discount Code: freecram)
<< Prev Question Next Question >>
Question 43/58
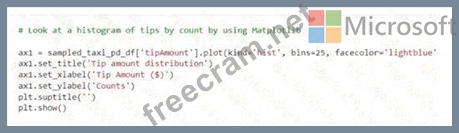
You have a Fabric notebook that has the Python code and output shown in the following exhibit.
Which type of analytics are you performing?
Which type of analytics are you performing?
Correct Answer: B
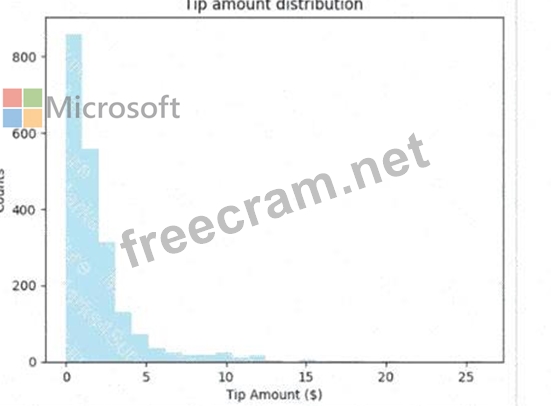
The Python code and output shown in the exhibit display a histogram, which is a representation of the distribution of data. This kind of analysis is descriptive analytics, which is used to describe or summarize the features of a dataset. Descriptive analytics answers the question of "what has happened" by providing insight into past data through tools such as mean, median, mode, standard deviation, and graphical representations like histograms.
References: Descriptive analytics and the use of histograms as a way to visualize data distribution are basic concepts in data analysis, often covered in introductory analytics and Python programming resources.
References: Descriptive analytics and the use of histograms as a way to visualize data distribution are basic concepts in data analysis, often covered in introductory analytics and Python programming resources.


- Question List (58q)
- Question 1: You create a semantic model by using Microsoft Power Bl Desk...
- Question 2: You have a Fabric tenant that contains a semantic model. The...
- Question 3: You have a Fabric tenant that contains a warehouse named WH1...
- Question 4: You need to create a data loading pattern for a Type 1 slowl...
- Question 5: You have a Fabric tenant that contains a lakehouse named Lak...
- Question 6: You have a Fabric tenant that contains a workspace named Wor...
- Question 7: You have a Fabric tenant You are creating a Fabric Data Fact...
- Question 8: You have a Microsoft Power Bl semantic model. You plan to im...
- Question 9: You have a Fabric tenant that contains a warehouse named DW1...
- Question 10: You have a Fabric tenant that contains a warehouse. You are ...
- Question 11: Note: This question is part of a series of questions that pr...
- Question 12: Which workspace rote assignments should you recommend for Re...
- Question 13: You are creating a semantic model in Microsoft Power Bl Desk...
- Question 14: Note: This section contains one or more sets of questions wi...
- Question 15: You need to migrate the Research division data for Productli...
- Question 16: You have a Fabric tenant tha1 contains a takehouse named Lak...
- Question 17: You have a Fabric tenant named Tenant1 that contains a works...
- Question 18: Note: This section contains one or more sets of questions wi...
- Question 19: You have a Fabric tenant that contains a workspace named Wor...
- Question 20: You have a Fabric tenant. You plan to create a Fabric notebo...
- Question 21: You have the source data model shown in the following exhibi...
- Question 22: You have a Fabric tenant that contains a semantic model. You...
- Question 23: You are creating a dataflow in Fabric to ingest data from an...
- Question 24: You have a Fabric tenant that uses a Microsoft tower Bl Prem...
- Question 25: Which syntax should you use in a notebook to access the Rese...
- Question 26: You have a Fabric tenant that contains a warehouse named War...
- Question 27: You have a Fabric tenant that contains a lakehouse named lak...
- Question 28: You are analyzing the data in a Fabric notebook. You have a ...
- Question 29: You have a Fabric tenant that contains customer churn data s...
- Question 30: You have source data in a folder on a local computer. You ne...
- Question 31: You are analyzing customer purchases in a Fabric notebook by...
- Question 32: You have a Fabric tenant that contains a new semantic model ...
- Question 33: You have a Fabric tenant that contains a lakehouse named Lak...
- Question 34: You have a Fabric tenant that contains a workspace named Wor...
- Question 35: You have a Fabric tenant that contains two workspaces named ...
- Question 36: You have a Fabric tenant that contains a data pipeline. You ...
- Question 37: You have a Fabric tenant that contains a semantic model name...
- Question 38: You have a Fabric tenant that contains a warehouse named War...
- Question 39: You have a data warehouse that contains a table named Stage....
- Question 40: You have a Fabric tenant that contains a data warehouse. You...
- Question 41: You have a Fabric tenant that contains a semantic model. The...
- Question 42: You have source data in a CSV file that has the following fi...
- Question 43: You have a Fabric notebook that has the Python code and outp...
- Question 44: You need to recommend which type of fabric capacity SKU meet...
- Question 45: You have a Fabric tenant that contains a warehouse. The ware...
- Question 46: You are implementing a medallion architecture in a single Fa...
- Question 47: You have a Fabric tenant You plan to create a data pipeline ...
- Question 48: You have a Fabric tenant that contains a complex semantic mo...
- Question 49: You have a Fabric warehouse that contains a table named Stag...
- Question 50: You have a Fabric workspace named Workspace1 that contains a...
- Question 51: You need to recommend a solution to group the Research divis...
- Question 52: You have a Fabric warehouse that contains a table named Sale...
- Question 53: You have a Fabric workspace named Workspace1 and an Azure Da...
- Question 54: You have a Fabric tenant that contains three users named Use...
- Question 55: You have a Fabric tenant that contains a warehouse. You use ...
- Question 56: Note: This question is part of a series of questions that pr...
- Question 57: You have a Fabric tenant. You need to configure OneLake secu...
- Question 58: You have a Fabric tenant that contains a Microsoft Power Bl ...
