Valid DA-100 Dumps shared by ExamDiscuss.com for Helping Passing DA-100 Exam! ExamDiscuss.com now offer the newest DA-100 exam dumps, the ExamDiscuss.com DA-100 exam questions have been updated and answers have been corrected get the newest ExamDiscuss.com DA-100 dumps with Test Engine here:
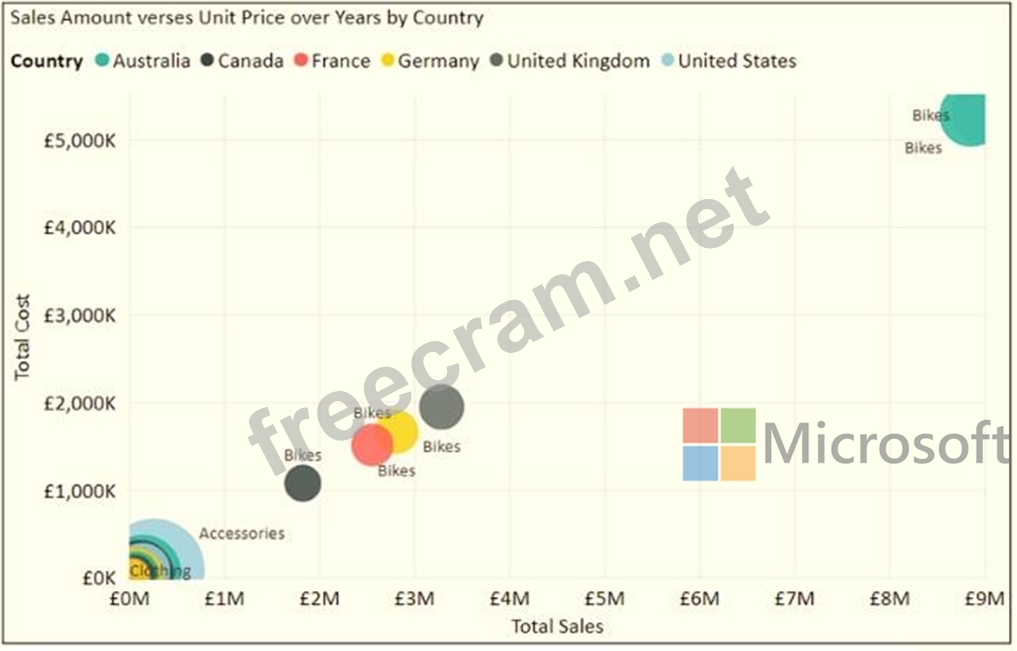
You have the visual shown in the exhibit. (Click the Exhibit tab.) You need to show the relationship between Total Cost and Total Sales over time. What should you do?
Correct Answer: A
Explanation You can set up a date field in play axis, and then scatter chart will animate how measure values are compared to each other in each point of a time. Reference: https://radacad.com/storytelling-with-power-bi-scatter-chart