<< Prev Question Next Question >>
Question 12/42
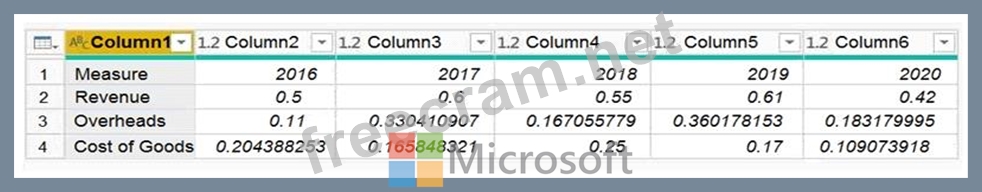
You are preparing a financial report in Power BI.
You connect to the data stored in a Microsoft Excel spreadsheet by using Power Query Editor as shown in the following exhibit.
You need to prepare the data to support the following:
Visualizations that include all measures in the data over time
Year-over-year calculations for all the measures
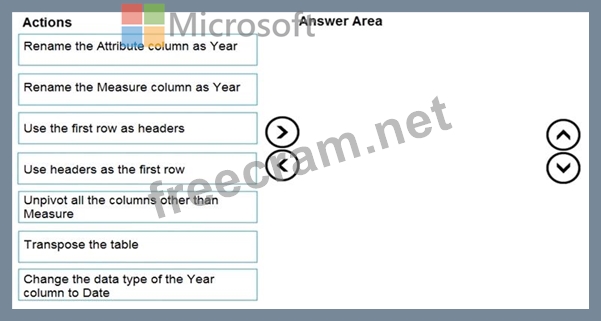
Which four actions should you perform in sequence? To answer, move the appropriate actions from the list of actions to the answer area and arrange them in the correct order.
You connect to the data stored in a Microsoft Excel spreadsheet by using Power Query Editor as shown in the following exhibit.
You need to prepare the data to support the following:
Visualizations that include all measures in the data over time
Year-over-year calculations for all the measures
Which four actions should you perform in sequence? To answer, move the appropriate actions from the list of actions to the answer area and arrange them in the correct order.


Recent Comments (The most recent comments are at the top.)
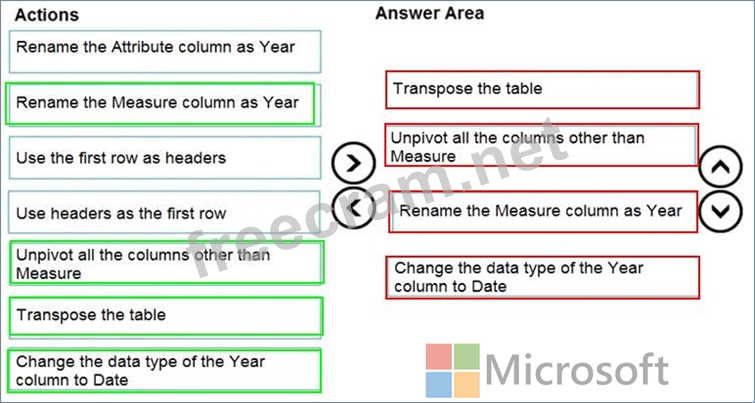
Answer:
1. Transponse the table.
2. Use the First Row as Headers.
3. Rename the Measure column as Year.
The step "Change tha data type of the Year column to Date" is redundant since value 2016 will be transform in 08.07.1905, 2017 - in 09.07.1905, 2018 - in 10.07.1905 etc.