Valid DA-100 Dumps shared by ExamDiscuss.com for Helping Passing DA-100 Exam! ExamDiscuss.com now offer the newest DA-100 exam dumps, the ExamDiscuss.com DA-100 exam questions have been updated and answers have been corrected get the newest ExamDiscuss.com DA-100 dumps with Test Engine here:
You need to create a visualization that compares revenue and cost over time. Which type of visualization should you use?
Correct Answer: C
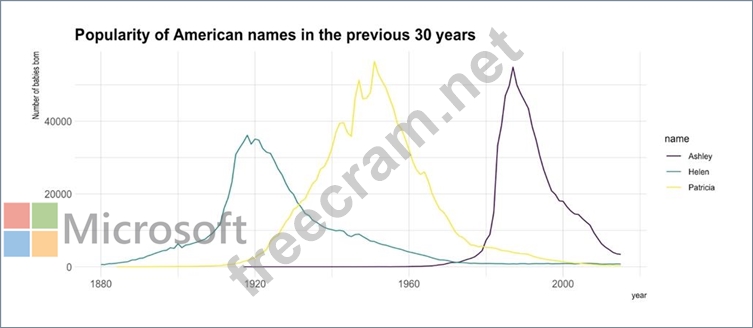
Explanation A line chart or line graph displays the evolution of one or several numeric variables. Data points are connected by straight line segments. A line chart is often used to visualize a trend in data over intervals of time - a time series - thus the line is often drawn chronologically. Example: Reference: https://www.data-to-viz.com/graph/line.html