Valid DA-100 Dumps shared by ExamDiscuss.com for Helping Passing DA-100 Exam! ExamDiscuss.com now offer the newest DA-100 exam dumps, the ExamDiscuss.com DA-100 exam questions have been updated and answers have been corrected get the newest ExamDiscuss.com DA-100 dumps with Test Engine here:
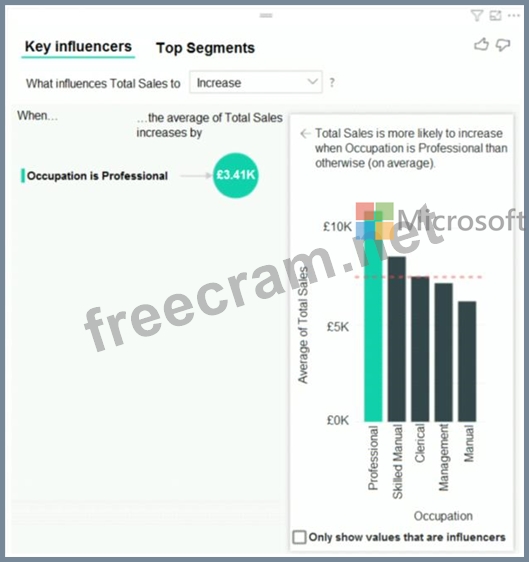
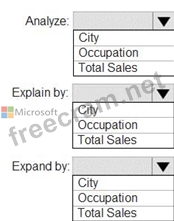
You have a table that contains the following three columns: * City * Total Sales * Occupation You need to create a key influencers visualization as shown in the exhibit. (Click the Exhibit tab.) How should you configure the visualization? To answer, select the appropriate options in the answer area. NOTE: Each correct selection is worth one point.
Correct Answer:
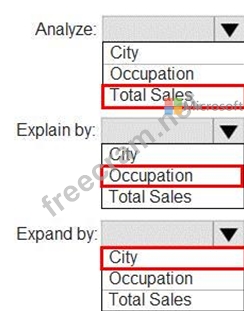
Explanation: Box 1: Total Sales Box 2: Occupation Box 3: City You can use Expand By to add fields you want to use for setting the level of the analysis without looking for new influencers. Reference: https://docs.microsoft.com/en-us/power-bi/visuals/power-bi-visualization-influencers