Valid DA-100 Dumps shared by ExamDiscuss.com for Helping Passing DA-100 Exam! ExamDiscuss.com now offer the newest DA-100 exam dumps, the ExamDiscuss.com DA-100 exam questions have been updated and answers have been corrected get the newest ExamDiscuss.com DA-100 dumps with Test Engine here:
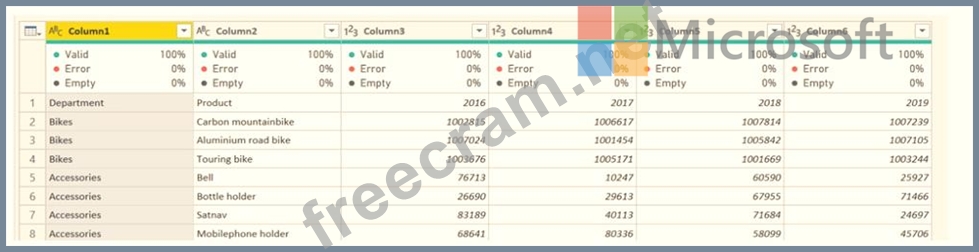
You receive revenue data that must be included in Microsoft Power Bl reports. You perform an initial load of the data from a Microsoft Excel source as shown in the following exhibit. You plan to create several visuals from the data, including a visual that shows revenue split by year and product. You need to transform the data to ensure that you can build the visuals. The solution must ensure that the columns are named appropriately for the data that they contain.
Correct Answer:
Recent Comments (The most recent comments are at the top.)
David Webb - Jun 26, 2021
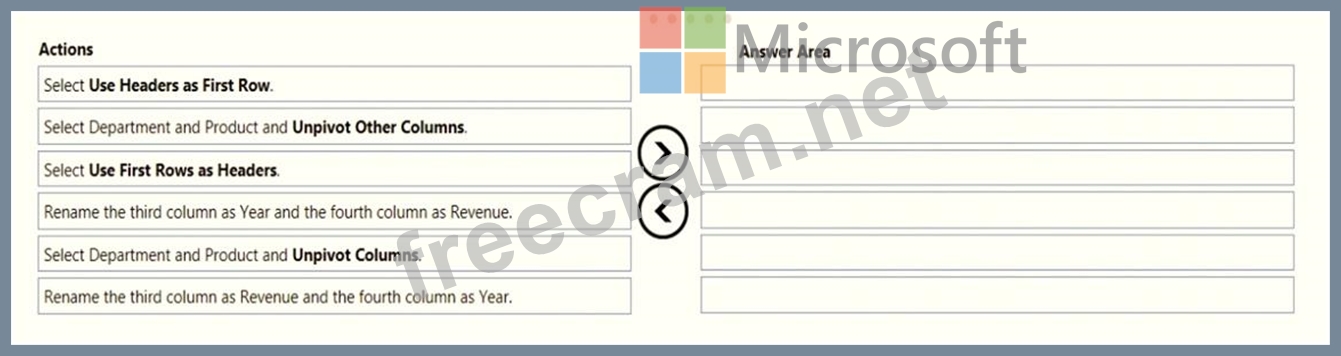
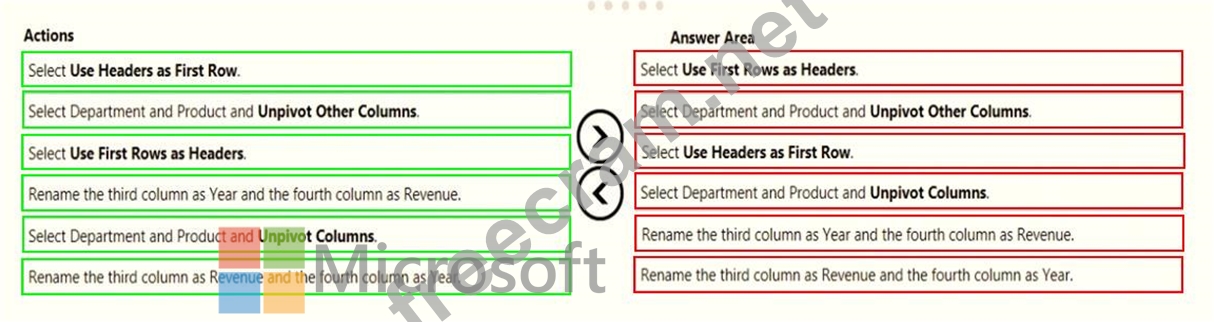
Only 3 actions are needed. 1. Select First Rows as Headers 2. Select Department and Product and Unpivot Other Columns 3. Rename the third column as Year and the fourth column as Revenue The solution has been verified in Power BI desktop with the table provided in the question. After the first steps, "Department Product 2016 2017 2018 2019" will become the column name. In the second steps, column name 2016 2017 2018 2019 will become the third column and the numbers will become the forth column. In the third steps, name the third and forth column correctly.


Recent Comments (The most recent comments are at the top.)
Only 3 actions are needed.
1. Select First Rows as Headers
2. Select Department and Product and Unpivot Other Columns
3. Rename the third column as Year and the fourth column as Revenue
The solution has been verified in Power BI desktop with the table provided in the question.
After the first steps, "Department Product 2016 2017 2018 2019" will become the column name.
In the second steps, column name 2016 2017 2018 2019 will become the third column and the numbers will become the forth column.
In the third steps, name the third and forth column correctly.