<< Prev Question Next Question >>
Question 6/30
HOTSPOT
Note: This question is part of a series of questions that use the same scenario. For your convenience, the scenario is repeated in each question. Each question presents a different goal and answer choices, but the text of the scenario is the same in each question in this series.
Start of repeated scenario
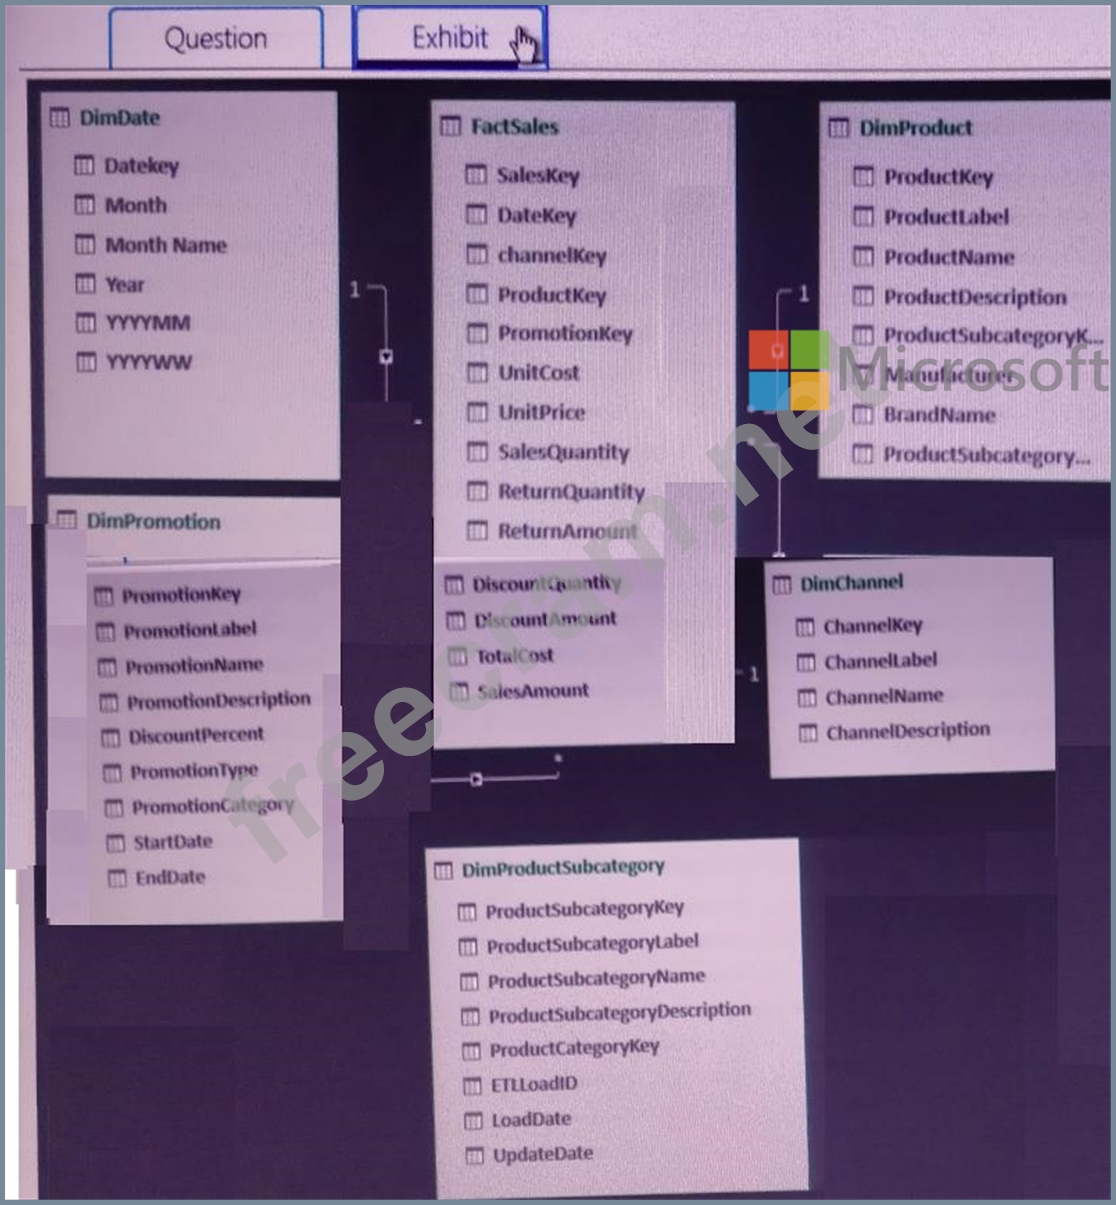
You have six workbook queries that each extracts a table from a Microsoft Azure SQL database. The tables are loaded to the data model, but the data is not loaded to any worksheet. The data model is shown in the Data Model exhibit. (Click the Exhibit button.) Your company has 100 product subcategories and more than 10,000 products.
End of repeated scenario.
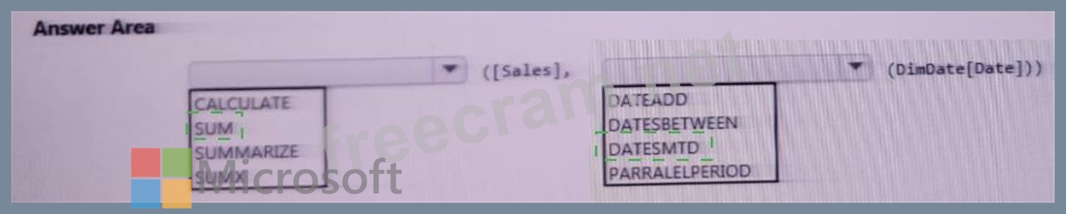
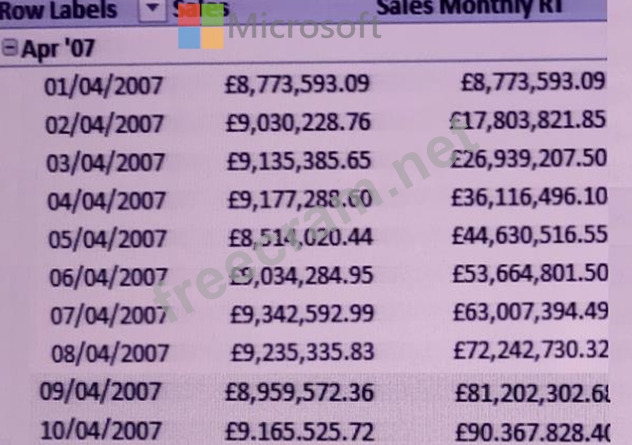
You need to create a measure named [Sales Monthly RT] that calculates a running total of
[Sales] for each date within a month as shown in the following exhibit.
Answer Area
Note: This question is part of a series of questions that use the same scenario. For your convenience, the scenario is repeated in each question. Each question presents a different goal and answer choices, but the text of the scenario is the same in each question in this series.
Start of repeated scenario
You have six workbook queries that each extracts a table from a Microsoft Azure SQL database. The tables are loaded to the data model, but the data is not loaded to any worksheet. The data model is shown in the Data Model exhibit. (Click the Exhibit button.) Your company has 100 product subcategories and more than 10,000 products.
End of repeated scenario.
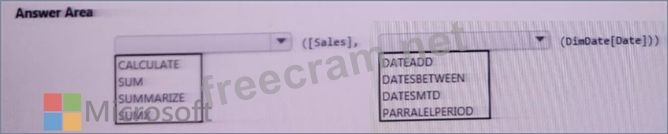
You need to create a measure named [Sales Monthly RT] that calculates a running total of
[Sales] for each date within a month as shown in the following exhibit.
Answer Area