<< Prev Question Next Question >>
Question 7/23
HOTSPOT
Note: This question is part of a series of questions that use the same scenario. For your convenience, the scenario is repeated in each question. Each question presents a different goal and answer choices, but the text of the scenario is the same in each question in this series.
Start of repeated scenario.
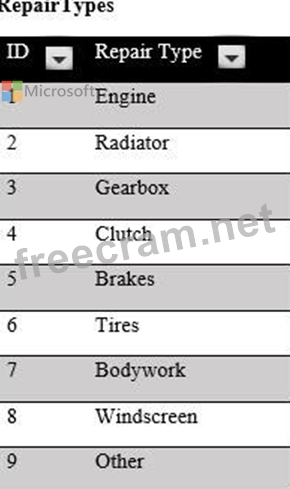
You are creating reports for a car repair company. You have four datasets in Excel spreadsheets. Four workbook queries load the datasets to a data model. A sample of the data is shown in the Data Sample exhibit. (Click the Exhibit button.)
Data Sample exhibit:
The data model is shown in the Data Model exhibit. (Click the Exhibit button.)
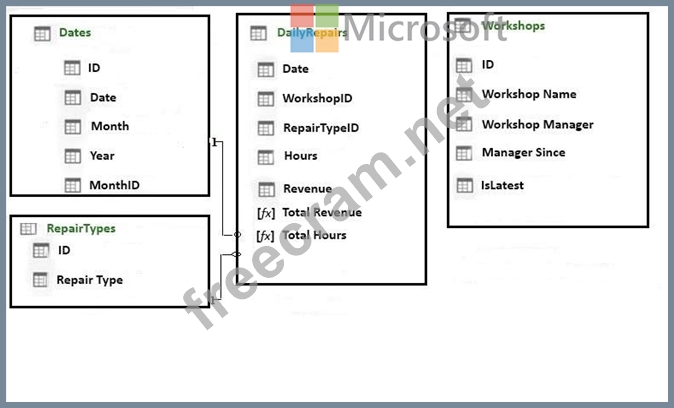
The tables in the model contain the following data:
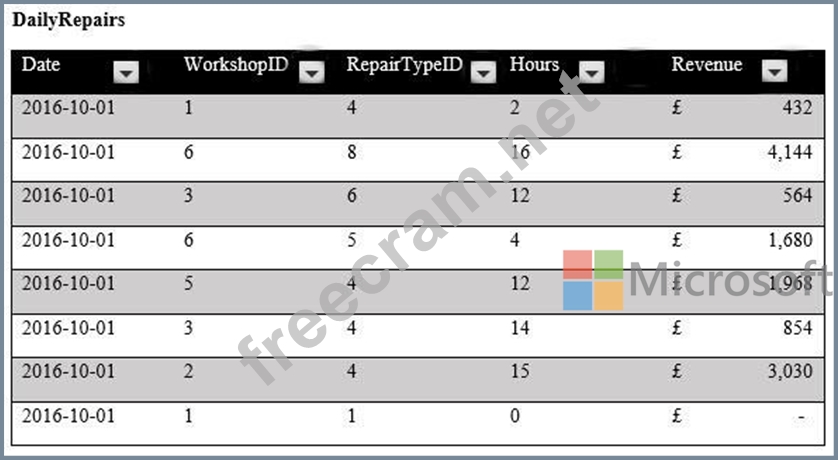
DailyRepairs has a log of hours and revenue for each day, workshop, and repair type. Every day, a log

entry is created for each workshop, even if no hours or revenue are recorded for that day. Total Hours and Total Revenue column.
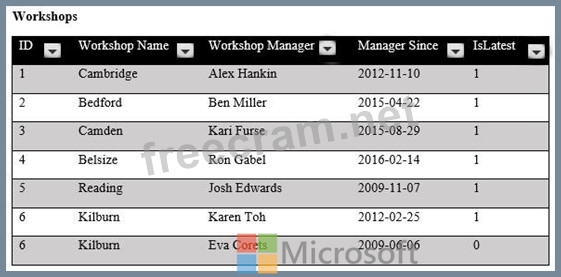
Workshops have a list of all the workshops and the current and previous workshop managers. The
format of the Workshop Manager column is always Firstname Lastname. A value of 1 in the IsLatest column indicates that the workshop manager listed in the record is the current workshop manager.
RepairTypes has a list of all the repair types
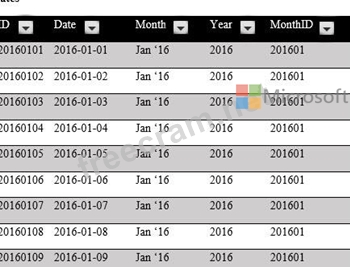
Dates has a list of dates from 2015 to 2018
End of repeated scenario.
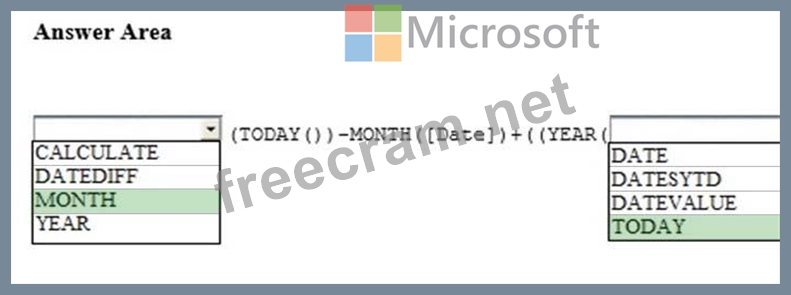
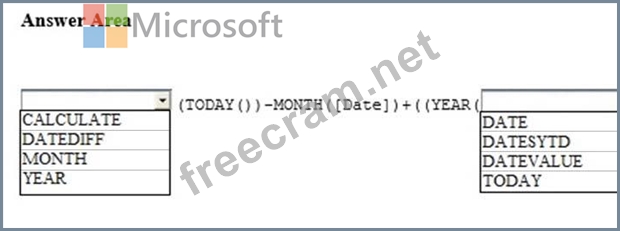
To the Dates table, you need to add a calculated column named Months Ago. Months Ago must display the number of calendar months before the current month. For example, if the current date is July 10, 2017, the Value of Months Ago will be 0 for all the dates in July 2017, 1 for all the dates in June 2017, and 2 for all the dates in May 2017.
How should you complete the DAX formula? To answer, select the appropriate options in the answer area.
NOTE: Each correct selection is worth one point.
Hot Area:
Note: This question is part of a series of questions that use the same scenario. For your convenience, the scenario is repeated in each question. Each question presents a different goal and answer choices, but the text of the scenario is the same in each question in this series.
Start of repeated scenario.
You are creating reports for a car repair company. You have four datasets in Excel spreadsheets. Four workbook queries load the datasets to a data model. A sample of the data is shown in the Data Sample exhibit. (Click the Exhibit button.)
Data Sample exhibit:
The data model is shown in the Data Model exhibit. (Click the Exhibit button.)
The tables in the model contain the following data:
DailyRepairs has a log of hours and revenue for each day, workshop, and repair type. Every day, a log
entry is created for each workshop, even if no hours or revenue are recorded for that day. Total Hours and Total Revenue column.
Workshops have a list of all the workshops and the current and previous workshop managers. The
format of the Workshop Manager column is always Firstname Lastname. A value of 1 in the IsLatest column indicates that the workshop manager listed in the record is the current workshop manager.
RepairTypes has a list of all the repair types
Dates has a list of dates from 2015 to 2018
End of repeated scenario.
To the Dates table, you need to add a calculated column named Months Ago. Months Ago must display the number of calendar months before the current month. For example, if the current date is July 10, 2017, the Value of Months Ago will be 0 for all the dates in July 2017, 1 for all the dates in June 2017, and 2 for all the dates in May 2017.
How should you complete the DAX formula? To answer, select the appropriate options in the answer area.
NOTE: Each correct selection is worth one point.
Hot Area: