<< Prev Question Next Question >>
Question 13/58
DRAG DROP
Note: This question is a part of a series of questions that present the same scenario. For your convenience, the scenario is repeated in each question. Each question presents a different goal and answer choices, but the text of the scenario is exactly the same in each question in this series.
Start of repeated scenario
You have a Microsoft SQL Server database that contains the following tables.
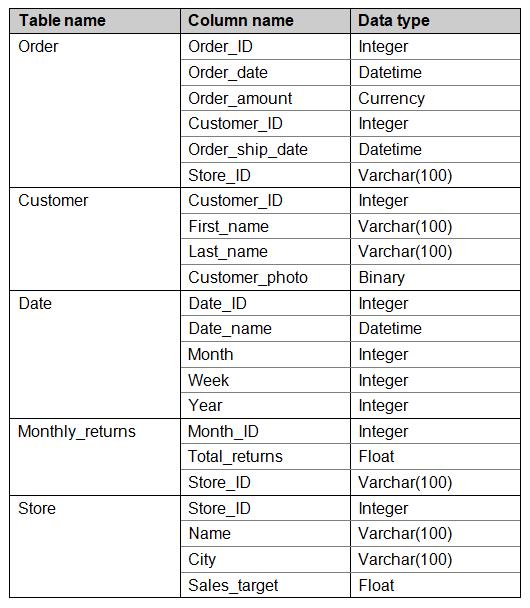
The following columns contain data information:
Date[Month] in the mmyyyy format

Date[Date_ID] in the ddmmyyyy format
Date[Date_name] in the mm/dd/yyyy format
Monthly_returns[Month_ID] in the mmyyyy format
The Order table contains more than one million rows.
The Store table has relationship to the Monthly_returns table on the Store_ID column. This is the only relationship between the tables.
You plan to use Power BI desktop to create an analytics solution for the data.
End of repeated scenario.
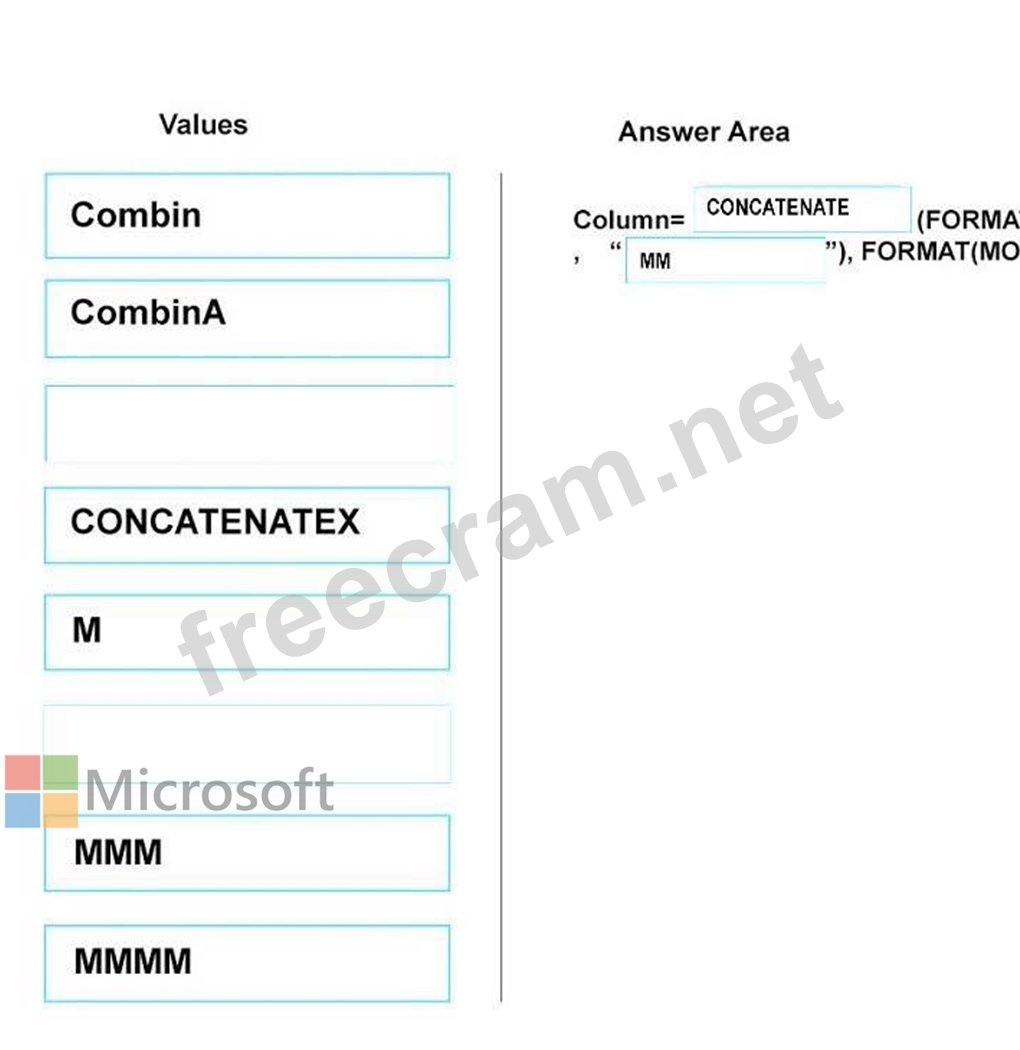
You need to display the month as a three-letter abbreviation, followed by the year, such as jan2017.
You add a calculated column in Power BI.
Which DAX formula should you use for the calculated column? To answer, drag the appropriate values to the correct targets. Each value may be used once, more than once, or not at all. You may need to drag the split bat between panes or scroll to view continent.
NOTE: Each correct selection is worth one point.
Select and Place:
Note: This question is a part of a series of questions that present the same scenario. For your convenience, the scenario is repeated in each question. Each question presents a different goal and answer choices, but the text of the scenario is exactly the same in each question in this series.
Start of repeated scenario
You have a Microsoft SQL Server database that contains the following tables.
The following columns contain data information:
Date[Month] in the mmyyyy format
Date[Date_ID] in the ddmmyyyy format
Date[Date_name] in the mm/dd/yyyy format
Monthly_returns[Month_ID] in the mmyyyy format
The Order table contains more than one million rows.
The Store table has relationship to the Monthly_returns table on the Store_ID column. This is the only relationship between the tables.
You plan to use Power BI desktop to create an analytics solution for the data.
End of repeated scenario.
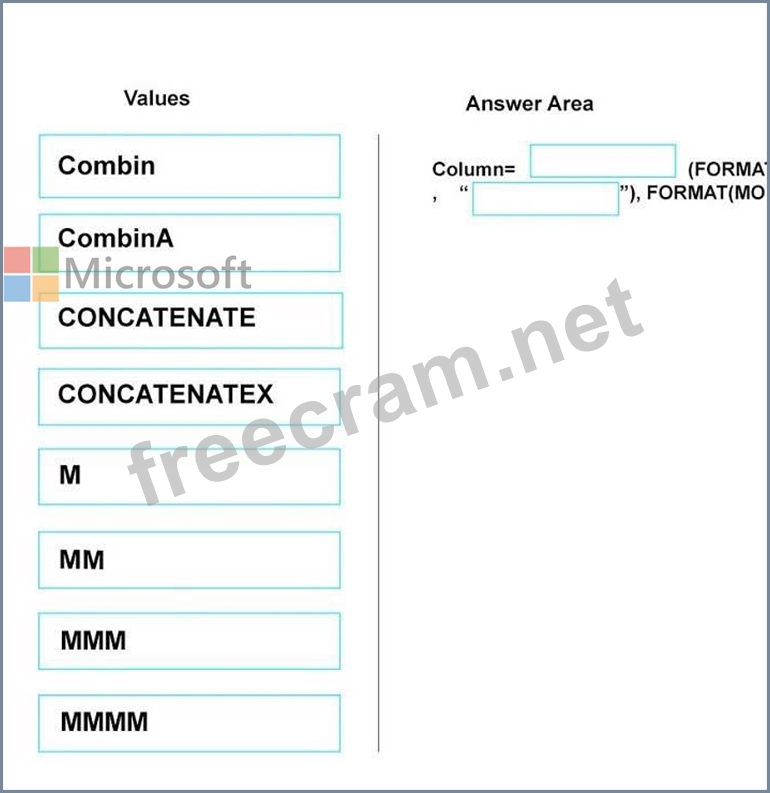
You need to display the month as a three-letter abbreviation, followed by the year, such as jan2017.
You add a calculated column in Power BI.
Which DAX formula should you use for the calculated column? To answer, drag the appropriate values to the correct targets. Each value may be used once, more than once, or not at all. You may need to drag the split bat between panes or scroll to view continent.
NOTE: Each correct selection is worth one point.
Select and Place: