- Home
- Microsoft
- Administering a SQL Database Infrastructure
- Microsoft.70-764.v2019-07-17.q247
- Question 138
Valid 70-764 Dumps shared by ExamDiscuss.com for Helping Passing 70-764 Exam! ExamDiscuss.com now offer the newest 70-764 exam dumps, the ExamDiscuss.com 70-764 exam questions have been updated and answers have been corrected get the newest ExamDiscuss.com 70-764 dumps with Test Engine here:
Access 70-764 Dumps Premium Version
(452 Q&As Dumps, 35%OFF Special Discount Code: freecram)
<< Prev Question Next Question >>
Question 138/247
Note: This question is part of a series of questions that use the same scenario. For your
convenience, the scenario is repeated in each question. Each question presents a different goal
and answer choices, but the text of the scenario is exactly the same in each question in this series.
Start of repeated scenario.
You are a database administrator for a company that has on-premises Microsoft SQL Server environment.
There are two domains in separate forests. There are no trust relationships between the domains. The
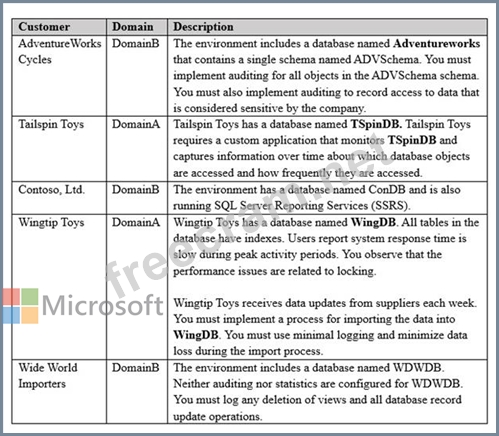
environment hosts several customer databases, and each customer uses a dedicated instance running
SQL Server 2016 Standard edition. The customer environments are shown in the following table.
End of repeated scenario.
You need to monitor WingDB and gather information for troubleshooting issues.
Which two tools should you use? Each correct answer presents a complete solution.
convenience, the scenario is repeated in each question. Each question presents a different goal
and answer choices, but the text of the scenario is exactly the same in each question in this series.
Start of repeated scenario.
You are a database administrator for a company that has on-premises Microsoft SQL Server environment.
There are two domains in separate forests. There are no trust relationships between the domains. The
environment hosts several customer databases, and each customer uses a dedicated instance running
SQL Server 2016 Standard edition. The customer environments are shown in the following table.
End of repeated scenario.
You need to monitor WingDB and gather information for troubleshooting issues.
Which two tools should you use? Each correct answer presents a complete solution.
Correct Answer: B,D
Explanation/Reference:
Explanation:
The performance issues is related to locking.
B: sp_lock reports snapshot information about locks, including the object ID, index ID, type of lock, and
type or resource to which the lock applies.
D: The Activity Monitor in SQL Server Management Studio is useful for ad hoc views of current activity and
graphically displays information about:
Processes running on an instance of SQL Server.

Blocked processes.
Locks.
User activity.
Incorrect Answers:
E: System Monitor primarily tracks resource usage, such as the number of buffer manager page requests
in use, enabling you to monitor server performance and activity using predefined objects and counters or
user-defined counters to monitor events. System Monitor (Performance Monitor in Microsoft Windows NT
4.0) collects counts and rates rather than data about the events (for example, memory usage, number of
active transactions, number of blocked locks, or CPU activity). You can set thresholds on specific counters
to generate alerts that notify operator
References: https://docs.microsoft.com/en-us/sql/relational-databases/performance/performance-
monitoring-and-tuning-tools?view=sql-server-2017
Explanation:
The performance issues is related to locking.
B: sp_lock reports snapshot information about locks, including the object ID, index ID, type of lock, and
type or resource to which the lock applies.
D: The Activity Monitor in SQL Server Management Studio is useful for ad hoc views of current activity and
graphically displays information about:
Processes running on an instance of SQL Server.
Blocked processes.
Locks.
User activity.
Incorrect Answers:
E: System Monitor primarily tracks resource usage, such as the number of buffer manager page requests
in use, enabling you to monitor server performance and activity using predefined objects and counters or
user-defined counters to monitor events. System Monitor (Performance Monitor in Microsoft Windows NT
4.0) collects counts and rates rather than data about the events (for example, memory usage, number of
active transactions, number of blocked locks, or CPU activity). You can set thresholds on specific counters
to generate alerts that notify operator
References: https://docs.microsoft.com/en-us/sql/relational-databases/performance/performance-
monitoring-and-tuning-tools?view=sql-server-2017


- Question List (247q)
- Question 1: Note: This question is part of a series of questions that pr...
- Question 2: Overview General Overview ADatum Corporation has offices in ...
- Question 3: You have a database that stores information for a shipping c...
- Question 4: Overview You are a database administrator for a company name...
- Question 5: Overview Application Overview Contoso, Ltd., is the develope...
- Question 6: You administer a Microsoft SQL Server 2016 database. Users r...
- Question 7: You need to provide a group of users from the IT and Manufac...
- Question 8: Note: This question is part of a series of questions that pr...
- Question 9: You have a SQL Server 2014 environment That contains 20 serv...
- Question 10: Note: This question is part of a series of questions that us...
- Question 11: You plan to implement a fault tolerance solution for a Micro...
- Question 12: You create a Management Data Warehouse instance and enable d...
- Question 13: You manage a Microsoft SQL Server environment. You plan to c...
- Question 14: You administer a Microsoft SQL Server 2016 server that hosts...
- Question 15: Note: This question is part of a series of questions that pr...
- Question 16: Your company stored customer data, including credit card num...
- Question 17: Note: This question is part of a series of questions that pr...
- Question 18: Overview You are a database administrator for a company name...
- Question 19: You administer a Microsoft SQL Server 2016 instance that has...
- Question 20: Note: This question is part of a series of questions that us...
- Question 21: You have a database named DB1. You plan to create a stored p...
- Question 22: Note: This question is part of a series of questions that pr...
- Question 23: You need to address the requirements for disc usage monitori...
- Question 24: You deploy a SQL Server instance named SQLProd that uses SQL...
- Question 25: You have a database named Saleshistory that records sales tr...
- Question 26: Overview Application Overview Contoso, Ltd., is the develope...
- Question 27: You administer a Microsoft SQL Server 2016 instance that con...
- Question 28: General Overview You are the Senior Database Administrator (...
- Question 29: You administer a Microsoft SQL Server 2016 server. You plan ...
- Question 30: Note: This question is part of a series of questions that us...
- Question 31: You plan to create a database. The database will be used by ...
- Question 32: Background Corporate Information Fabrikam, Inc. is a retaile...
- Question 33: You have the following Microsoft SQL Server instances: (Exhi...
- Question 34: Overview General Overview ADatum Corporation has offices in ...
- Question 35: Note: This question is part of a series of questions that us...
- Question 36: Note: This question is part of a series of questions that us...
- Question 37: Note: This question is part of a series of questions that pr...
- Question 38: A Microsoft SQL Server database named DB1 has two filegroups...
- Question 39: You manage a Microsoft SQL Server environment. You plan to c...
- Question 40: You manage a Microsoft SQL Server environment. You plan to e...
- Question 41: You administer a Microsoft SQL Server 2016 instance. You dis...
- Question 42: Note: This question is part of a series of questions that pr...
- Question 43: You create an availability group named HaContoso that has re...
- Question 44: Overview General Overview ADatum Corporation has offices in ...
- Question 45: Note: This question is part of a series of questions that us...
- Question 46: You have an application that queries a database. Users repor...
- Question 47: You maintain a database named DB1 that has a nonpartitioned ...
- Question 48: You have a database that stores information for a shipping c...
- Question 49: Note: This question is part of a series of questions that pr...
- Question 50: General Overview You are the Senior Database Administrator (...
- Question 51: Overview Application Overview Contoso, Ltd., is the develope...
- Question 52: You have an application that queries a database. Users repor...
- Question 53: You administer a Microsoft SQL Server 2016 database named Co...
- Question 54: Note: This question is part of a series of questions that pr...
- Question 55: You plan to migrate the db to azure. You verify that all obj...
- Question 56: You work as a Database Administrator (DBA) for a company nam...
- Question 57: You administer a Microsoft SQL Server 2016 server. The MSSQL...
- Question 58: You administer a Microsoft SQL Server 2016 server. When tran...
- Question 59: You are creating an application that will connect to the Age...
- Question 60: You plan to integrate an on-premises Microsoft SQL Server en...
- Question 61: Note: This question is part of a series of questions that us...
- Question 62: Note: This question is part of a series of questions that pr...
- Question 63: Note: This question is part of a series of questions that pr...
- Question 64: Note: This question is part of a series of questions that us...
- Question 65: Note: This question is part of a series of questions that us...
- Question 66: You work as a Database Administrator (DBA) for a company nam...
- Question 67: You have a Microsoft SQL Server instance that has a database...
- Question 68: You have a table that has grown in the past six months. A us...
- Question 69: Background Corporate Information Fabrikam, Inc. is a retaile...
- Question 70: You have the following servers: (Exhibit) SQL1 hosts a datab...
- Question 71: You have a database named DB1. Users report that a database ...
- Question 72: Note: This question is part of a series of questions that us...
- Question 73: Note: This question is part of a series of questions that us...
- Question 74: Note: This question is part of a series of questions that us...
- Question 75: You have 10 Microsoft SQL Server 2016 servers. You deploy a ...
- Question 76: Note: This question is part of a series of questions that us...
- Question 77: You are the administrator for a SQL Server 2014 instance tha...
- Question 78: Overview Application Overview Contoso, Ltd., is the develope...
- Question 79: Note: This question is part of a series of questions that pr...
- Question 80: You administer a Microsoft SQL Server 2016 database. You pro...
- Question 81: You have a query that is used by a reporting dashboard. User...
- Question 82: You administer a Microsoft SQL Server 2016 instance. The ins...
- Question 83: Note: This question is part of a series of questions that pr...
- Question 84: You have two SQL Server instances named SQLDev and SQLProd t...
- Question 85: You administer a SQL Server 2016 database instance. You need...
- Question 86: You administer all the deployments of Microsoft SQL Server 2...
- Question 87: Note: This question is part of a series of questions that pr...
- Question 88: You install a Microsoft SQL Server 2016 instance. The instan...
- Question 89: You use SQL Azure to store data used by an e-commerce applic...
- Question 90: Note: This question is part of a series of questions that pr...
- Question 91: Overview Application Overview Contoso, Ltd., is the develope...
- Question 92: Note: This question is part of a series of questions that pr...
- Question 93: You administer a Microsoft SQL Server 2016 database that inc...
- Question 94: Note: This question is part of a series of questions that pr...
- Question 95: You configure log shipping on two servers named SQL1 and SQL...
- Question 96: You have a server named Server1 that has 2 processors. You p...
- Question 97: You are building a stored procedure for a SQL Azure database...
- Question 98: You administer a single server that contains a Microsoft SQL...
- Question 99: You have a SQL Server 2012 database named DB1. You have a ba...
- Question 100: Note: This question is part of a series of questions that pr...
- Question 101: You administer a Microsoft SQL Server 2016 server that hosts...
- Question 102: Note: This question is part of a series of questions that pr...
- Question 103: Overview General Overview ADatum Corporation has offices in ...
- Question 104: Note: This question is part of a series of questions that pr...
- Question 105: Note: This question is part of a series of questions that pr...
- Question 106: Note: This question is part of a series of questions that pr...
- Question 107: Overview You are a database administrator for a company name...
- Question 108: You are planning on deploying a server that will be dedicate...
- Question 109: You are designing a database named DB1. Changes will be depl...
- Question 110: Note: This question is part of a series of questions that us...
- Question 111: Note: This question is part of a series of questions that pr...
- Question 112: You administer two Microsoft SQL Server 2012 servers. Each s...
- Question 113: Note: This question is part of a series of questions that us...
- Question 114: Background Corporate Information Fabrikam, Inc. is a retaile...
- Question 115: You need to move a database in between servers. You need to ...
- Question 116: You are creating a database that will store usernames and cr...
- Question 117: You are a database administrator for a Microsoft SQL Server ...
- Question 118: You administer a Microsoft SQL Server 2016 database named Or...
- Question 119: Overview You are a database administrator for a company name...
- Question 120: You plan to install Microsoft SQL Server 2016 for a web host...
- Question 121: You have a server named Server1 that has 16 processors. You ...
- Question 122: You administer a Windows Azure SQL Database database named I...
- Question 123: You need to grant access to an OLTP database regardless of t...
- Question 124: Overview General Overview ADatum Corporation has offices in ...
- Question 125: You plan to create a database. The database will be used by ...
- Question 126: Note: This question is part of a series of questions that us...
- Question 127: You maintain a Microsoft SQL Server database named DB1. You ...
- Question 128: Note: This question is part of a series of questions that pr...
- Question 129: You configure the Microsoft SQL Server Agent service to star...
- Question 130: Which feature should you enable and configure so session req...
- Question 131: You have a SQL Server 2012 database named DB1. You plan to i...
- Question 132: You manage database servers in a high security environment. ...
- Question 133: Note: This question is part of a series of questions that pr...
- Question 134: You administer a Microsoft SQL Server 2016 database that con...
- Question 135: You administer a Microsoft SQL Server database named Sales. ...
- Question 136: Note: This question is part of a series of questions that us...
- Question 137: Overview You are a database administrator for a company name...
- Question 138: Note: This question is part of a series of questions that us...
- Question 139: Note: This question is part of a series of questions that us...
- Question 140: General Overview You are the Senior Database Administrator (...
- Question 141: You administer two instances of Microsoft SQL Server 2016. Y...
- Question 142: You need to address the Sales Director's requirements regard...
- Question 143: Note: This question is part of a series of questions that us...
- Question 144: You administer a Microsoft SQL Server 2016 database. The dat...
- Question 145: A company has an on-premises Microsoft SQL Server environmen...
- Question 146: Note: This question is part of a series of questions that pr...
- Question 147: Your company has a SQL Azure subscription. You implement a d...
- Question 148: You have an SQL Server 2014 server named SQL1. You are desig...
- Question 149: Note: This question is part of a series of questions that pr...
- Question 150: You are troubleshooting an application that runs a query. Th...
- Question 151: You install Microsoft SQL Server 2016 on a new server. After...
- Question 152: You administer a Microsoft SQL Server 2016 database that has...
- Question 153: Note: This question is part of a series of questions that pr...
- Question 154: You administer a SQL Server 2014 instance. Users report that...
- Question 155: Overview Application Overview Contoso, Ltd., is the develope...
- Question 156: You administer a Microsoft SQL Server 2016 server. One of th...
- Question 157: You plan to install a Microsoft SQL Server 2016 instance. Th...
- Question 158: Note: This question is part of a series of questions that pr...
- Question 159: Background Corporate Information Fabrikam, Inc. is a retaile...
- Question 160: Overview General Overview ADatum Corporation has offices in ...
- Question 161: Note: This question is part of a series of questions that pr...
- Question 162: Note: This question is part of a series of questions that us...
- Question 163: You administer a Microsoft SQL Server 2016 instance that has...
- Question 164: You administer a Microsoft SQL Server 2016 database named Co...
- Question 165: You are troubleshooting an application that runs a query. Th...
- Question 166: Note: This question is part of a series of questions that pr...
- Question 167: You administer a Microsoft SQL Server 2016 Enterprise Editio...
- Question 168: Overview You are a database administrator for a company name...
- Question 169: You have a SQL Server 2014 environment That includes four se...
- Question 170: You administer a Microsoft SQL Server 2016 database. You hav...
- Question 171: You maintain a database named DB1 that has a nonpartitioned ...
- Question 172: You manage a Microsoft SQL Server environment. You plan to e...
- Question 173: General Overview You are the Senior Database Administrator (...
- Question 174: Background Corporate Information Fabrikam, Inc. is a retaile...
- Question 175: Background Corporate Information Fabrikam, Inc. is a retaile...
- Question 176: General Overview You are the Senior Database Administrator (...
- Question 177: Note: This question is part of a series of questions that pr...
- Question 178: Note: This question is part of a series of questions that us...
- Question 179: Overview General Overview ADatum Corporation has offices in ...
- Question 180: Note: This question is part of a series of questions that us...
- Question 181: You administer a Microsoft SQL Server 2016 server that hosts...
- Question 182: You work as a Developer at ABC.com. All databases are hosted...
- Question 183: You are a database administrator for an organization. You mu...
- Question 184: You work as a Database Administrator (DBA) for a company nam...
- Question 185: Your company has offices in Seattle and Montreal. The networ...
- Question 186: You deploy a database by using SQL Server 2014. The database...
- Question 187: You want to reproduce the same SQL Server 2016 installation ...
- Question 188: Note: This question is part of a series of questions that pr...
- Question 189: Overview General Overview ADatum Corporation has offices in ...
- Question 190: Note: This question is part of a series of questions that pr...
- Question 191: Your company has offices in Seattle and Montreal. The networ...
- Question 192: You need to ensure that a stored procedure fails if an INSER...
- Question 193: You use SQL Server 2014 to maintain the data used by applica...
- Question 194: You work as a Database Administrator (DBA) for a company nam...
- Question 195: You are implementing a SQL Server 2016 five-node failover cl...
- Question 196: You have two databases named DB1 and DB2 that are located on...
- Question 197: You work as a Database Administrator (DBA) for a company nam...
- Question 198: You have a Microsoft SQL Server database named DB1. Nested a...
- Question 199: You administer a Microsoft SQL Server 2016 instance. You nee...
- Question 200: Overview You are a database administrator for a company name...
- Question 201: Note: This question is part of a series of questions that us...
- Question 202: You administer a Microsoft SQL Server 2012 instance. You nee...
- Question 203: You work as a Database Administrator (DBA) for a company nam...
- Question 204: You are a database administrator for Contoso, Ltd. You confi...
- Question 205: You administer a Microsoft SQL Server 2016 database named Co...
- Question 206: Note: This question is part of a series of questions that pr...
- Question 207: You have multiple Microsoft SQL Server databases that are de...
- Question 208: You administer a Microsoft SQL Server 2016 database named Co...
- Question 209: Note: This question is part of a series of questions that us...
- Question 210: You need to recommend a solution to meet the recovery requir...
- Question 211: General Overview You are the Senior Database Administrator (...
- Question 212: Note: This question is part of a series of questions that us...
- Question 213: Note: This question is part of a series of questions that pr...
- Question 214: You administer a Windows Azure SQL Database database named H...
- Question 215: Overview Application Overview Contoso, Ltd., is the develope...
- Question 216: Overview General Overview ADatum Corporation has offices in ...
- Question 217: Overview Application Overview Contoso, Ltd., is the develope...
- Question 218: You are the new database administrator for a SQL Server 2014...
- Question 219: You administer a Microsoft SQL Server 2016 database that has...
- Question 220: You work as a Database Administrator (DBA) at ABC.com. All d...
- Question 221: You have a database named DB1 that is configured to use the ...
- Question 222: You have a server that has SQL Server 2014 installed. The se...
- Question 223: Note: This question is part of a series of questions that pr...
- Question 224: Which feature should you enable and configure so session req...
- Question 225: Overview Application Overview Contoso, Ltd., is the develope...
- Question 226: You administer a Microsoft SQL Server 2016 database named Co...
- Question 227: Note: This question is part of a series of questions that pr...
- Question 228: You work as a Database Administrator (DBA) for a company nam...
- Question 229: You create an availability group that has replicas named HA/...
- Question 230: You have a database hosted on SQL Server 2012 R2. The databa...
- Question 231: You administer a Microsoft SQL Server 2016 database named Co...
- Question 232: You are designing a Windows Azure SQL Database for an order ...
- Question 233: Note: This question is part of a series of questions that pr...
- Question 234: Overview Application Overview Contoso, Ltd., is the develope...
- Question 235: Note: This question is part of a series of questions that pr...
- Question 236: Note: This question is part of a series of questions that pr...
- Question 237: General Overview You are the Senior Database Administrator (...
- Question 238: Overview General Overview ADatum Corporation has offices in ...
- Question 239: You work as a Database Administrator (DBA) for a company nam...
- Question 240: Note: This question is part of a series of questions that us...
- Question 241: You have a SQL Server 2014 instance named SQL1. SQL1 creates...
- Question 242: You administer a Microsoft SQL Server 2016 database. You nee...
- Question 243: Note: This question is part of a series of questions that us...
- Question 244: You maintain Microsoft SQL Server instances named SVR1 and S...
- Question 245: You are designing a monitoring application for a new SQL Ser...
- Question 246: Overview General Overview ADatum Corporation has offices in ...
- Question 247: Overview You are a database administrator for a company name...
