Valid 70-762 Dumps shared by EduDump.com for Helping Passing 70-762 Exam! EduDump.com now offer the newest 70-762 exam dumps, the EduDump.com 70-762 exam questions have been updated and answers have been corrected get the newest EduDump.com 70-762 dumps with Test Engine here:
Access 70-762 Dumps Premium Version
(185 Q&As Dumps, 35%OFF Special Discount Code: freecram)
<< Prev Question Next Question >>
Question 59/85
DRAG DROP
You are monitoring a Microsoft Azure SQL Database.
The database is experiencing high CPU consumption.
You need to determine which query uses the most cumulative CPU.
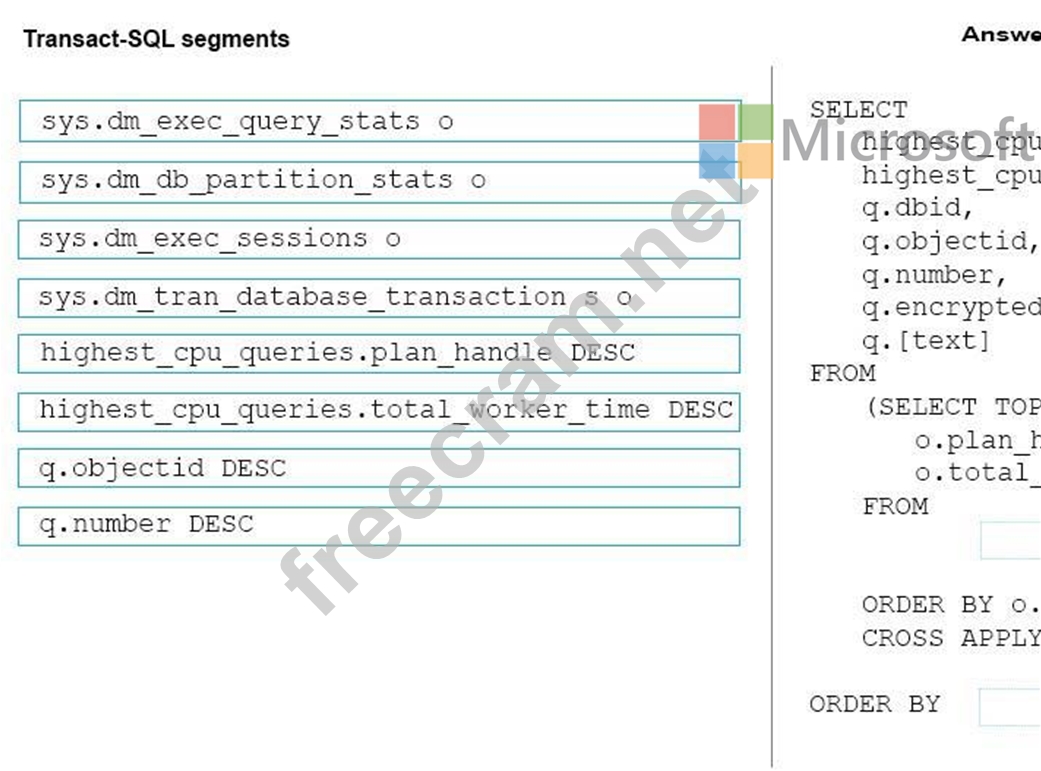
How should you complete the Transact-SQL statement? To answer, drag the appropriate Transact-SQL segments to the correct locations. Each Transact-SQL segment may be used once, more than one or not at all. You may need to drag the split bar between panes or scroll to view content.
Select and Place:
You are monitoring a Microsoft Azure SQL Database.
The database is experiencing high CPU consumption.
You need to determine which query uses the most cumulative CPU.
How should you complete the Transact-SQL statement? To answer, drag the appropriate Transact-SQL segments to the correct locations. Each Transact-SQL segment may be used once, more than one or not at all. You may need to drag the split bar between panes or scroll to view content.
Select and Place:
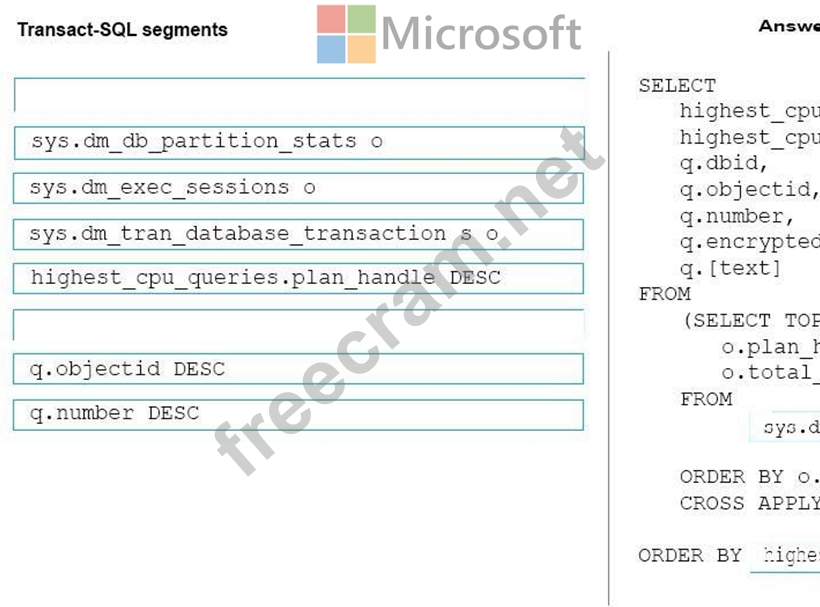
Correct Answer:
Explanation/Reference:
Box 1: sys.dm_exec_query_stats
sys.dm_exec_query_stats returns aggregateperformance statistics for cached query plans in SQL Server.
Box 2: highest_cpu_queries.total_worker_time DESC
Sort on total_worker_time column
Example: The following example returns information about the top five queries ranked by average CPU time.
Thisexample aggregates the queries according to their query hash so that logically equivalentqueries are grouped by their cumulative resource consumption.
USE AdventureWorks2012;
GO
SELECT TOP 5 query_stats.query_hash AS "Query Hash",
SUM(query_stats.total_worker_time) / SUM(query_stats.execution_count) AS "Avg CPU Time", MIN(query_stats.statement_text) AS "Statement Text" FROM (SELECT QS.*,
SUBSTRING(ST.text, (QS.statement_start_offset/2) + 1,
((CASE statement_end_offset
WHEN -1 THEN DATALENGTH(ST.text)
ELSE QS.statement_end_offset END
- QS.statement_start_offset)/2) + 1) AS statement_text
FROM sys.dm_exec_query_stats AS QS
CROSS APPLY sys.dm_exec_sql_text(QS.sql_handle)as ST) as query_stats
GROUP BY query_stats.query_hash
ORDER BY 2 DESC;
References: https://msdn.microsoft.com/en-us/library/ms189741.aspx


- Question List (85q)
- Question 1: Note: This question is part of a series of questions that us...
- Question 2: HOTSPOT Note: This question is part of a series of questions...
- Question 3: DRAG DROP Note: This question is part of a series of questio...
- Question 4: HOTSPOT Note: This question is part of a series of questions...
- Question 5: DRAG DROP Note: This question is part of a series of questio...
- Question 6: You are developing an application that connects to a databas...
- Question 7: Note: This question is part of a series of questions that pr...
- Question 8: Note: The question is part of a series of questions that use...
- Question 9: HOTSPOT Note: This question is part of a series of questions...
- Question 10: Note: this question is part of a series of questions that us...
- Question 11: Note: This question is part of a series of questions that us...
- Question 12: Note: this question is part of a series of questions that us...
- Question 13: Note: This question is part of a series of questions that us...
- Question 14: Note: The question is part of a series of questions that use...
- Question 15: Note: This question is part of a series of questions that pr...
- Question 16: HOTSPOT Note: This question is part of a series of questions...
- Question 17: Note: This question is part of a series of questions that pr...
- Question 18: HOTSPOT Background You have a database named HR1 that includ...
- Question 19: Note: This question is part of a series of questions that us...
- Question 20: You use Microsoft SQL Server Profile to evaluate a query nam...
- Question 21: Note: This question is part of a series of questions that us...
- Question 22: HOTSPOT You are profiling a frequently used database table n...
- Question 23: HOTSPOT You are analyzing the performance of a database envi...
- Question 24: You are experiencing performance issues with the database se...
- Question 25: Note: This question is part of a series of questions that pr...
- Question 26: Note: This question is part of a series of questions that us...
- Question 27: Note: This question is part of a series of questions that us...
- Question 28: You have a database that is experiencing deadlock issues whe...
- Question 29: Note: This question is part of a series of questions that pr...
- Question 30: DRAG DROP You need to build a function that meets the follow...
- Question 31: DRAG DROP You are evaluating the performance of a database e...
- Question 32: DRAG DROP You have a database that contains three encrypted ...
- Question 33: DRAG DROP Note: This question is part of a series of questio...
- Question 34: HOTSPOT Note: This question is part of a series of questions...
- Question 35: Note: This question is part of a series of questions that pr...
- Question 36: Note: This question is part of a series of questions that us...
- Question 37: Note: This question is part of a series of questions that us...
- Question 38: DRAG DROP You have a Microsoft Azure SQL Database named MyDb...
- Question 39: Note: This question is part of a series of questions that pr...
- Question 40: Note: This question is part of a series of questions that pr...
- Question 41: DRAG DROP You must create two staging database tables. The t...
- Question 42: HOTSPOT You are developing an app that allows users to query...
- Question 43: HOTSPOT You have a database that contains both disk-based an...
- Question 44: Note: This question is part of a series of questions that pr...
- Question 45: Note: this question is part of a series of questions that us...
- Question 46: DRAG DROP You are analyzing the performance of a database en...
- Question 47: DRAG DROP You have a database named MyDatabase. You must mon...
- Question 48: Note: This question is part of a series of questions that us...
- Question 49: Note: This question is part of a series of questions that pr...
- Question 50: Note: this question is part of a series of questions that us...
- Question 51: DRAG DROP You are analyzing the performance of a database en...
- Question 52: DRAG DROP Note: This question is part of a series of questio...
- Question 53: Note: This question is part of a series of questions that pr...
- Question 54: Note: This question is part of a series of questions that pr...
- Question 55: HOTSPOT You have a database named Sales. You need to create ...
- Question 56: Note: This question is part of a series of questions that pr...
- Question 57: You are experiencing performance issues with the database se...
- Question 58: Note: This question is part of a series of questions that us...
- Question 59: DRAG DROP You are monitoring a Microsoft Azure SQL Database....
- Question 60: You have a view that includes an aggregate. You must be able...
- Question 61: Case Study Background You have a database named HR1 that inc...
- Question 62: HOTSPOT Note: This question is part of a series of questions...
- Question 63: DRAG DROP You are creating a stored procedure which will ins...
- Question 64: Note: This question is part of a series of questions that pr...
- Question 65: HOTSPOT Note: This question is part of a series of questions...
- Question 66: DRAG DROP You have two database tables. Table1 is a partione...
- Question 67: Note: This question is part of a series of questions that us...
- Question 68: Note: This question is part of a series of questions that pr...
- Question 69: DRAG DROP Note: This question is part of a series of questio...
- Question 70: Note: This question is part of a series of questions that pr...
- Question 71: DRAG DROP Note: This question is part of a series of questio...
- Question 72: Note: This question is part of a series of questions that us...
- Question 73: HOTSPOT You create a database table named FactSales by runni...
- Question 74: HOTSPOT You are reviewing the execution plans in the query p...
- Question 75: HOTSPOT Note: This question is part of a series of questions...
- Question 76: Note: This question is part of a series of questions that pr...
- Question 77: Note: This question is part of a series of questions that us...
- Question 78: DRAG DROP You are analyzing the memory usage of a Microsoft ...
- Question 79: HOTSPOT You are maintaining statistics for a database table ...
- Question 80: DRAG DROP You have a trigger named CheckTriggerCreation that...
- Question 81: Note: This question is part of a series of questions that pr...
- Question 82: Note: The question is part of a series of questions that use...
- Question 83: Note: this question is part of a series of questions that us...
- Question 84: Background You have a database named HR1 that includes a tab...
- Question 85: HOTSPOT Background You have a database named HR1 that includ...
