- Home
- Microsoft
- Developing Microsoft SQL Server Databases
- Microsoft.70-464.v2018-04-17.q110
- Question 8
Valid 70-464 Dumps shared by EduDump.com for Helping Passing 70-464 Exam! EduDump.com now offer the newest 70-464 exam dumps, the EduDump.com 70-464 exam questions have been updated and answers have been corrected get the newest EduDump.com 70-464 dumps with Test Engine here:
Access 70-464 Dumps Premium Version
(200 Q&As Dumps, 35%OFF Special Discount Code: freecram)
<< Prev Question Next Question >>
Question 8/110
You have a SQL Server 2012 database named database1.
Users report that queries that usually take less than one second to execute, take more than 30 seconds to execute.
You need to view the server resource consumption when the queries are executed.
What should you do?
To answer, move the appropriate actions from the list of actions to the answer area and arrange them in the correct order.
Select and Place:
Correct Answer:
Explanation/Reference:
Explanation:
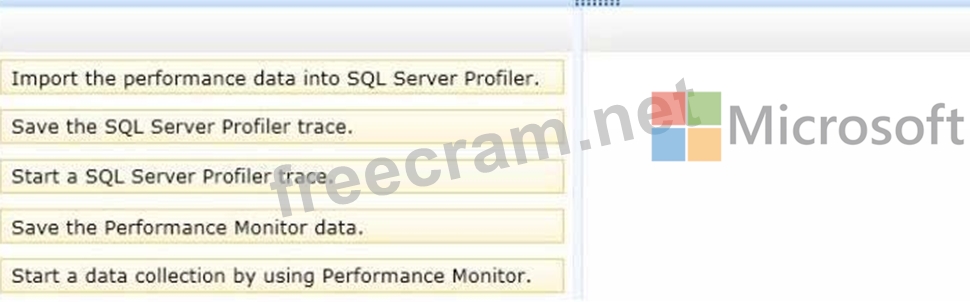
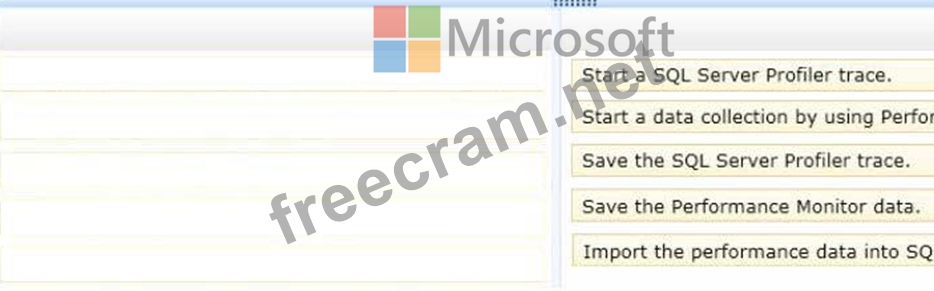
Box 1: Start a SQL Server Profiler trace.
Box 2: Start a data collection by using Performance monitor.
Box 3: Save the SQL Profiler trace.
Box 4: Save the Performance Monitor data.
Box 5: Import the performance data into SQL Server Profiler.
Note:
* (step1, step 2) Both the Profiler trace and the Performance Monitor logs should be started and stopped at about the same time.
* (step 3, step 4) Once you have completed capturing the data for both tools, you are ready to perform the correlation analysis.
* (step 5) How to Correlate SQL Server Profiler Data with Performance Monitor Data Correlating Performance Monitor and Profiler data is a straightforward process that simply involves importing both sets of data into Profiler. Start Profiler and load the trace file you want to correlate.
From the main menu of Profiler, select File | Import Performance Data,
* With SQL Server Profiler, we have the tools to identify the causes of such spikes. We can import Performance Monitor log data and compare it directly with Profiler activity. If we see a spike in CPU utilization, we can identify which statement or statements were running at the same time, and diagnose potential problems.


- Question List (110q)
- Question 1: You have a table named Rooms that contains three columns. Yo...
- Question 2: B\Batch 1 While testing usp.GetFutureSessions, you discover ...
- Question 3: You need to modify the Orders table to store the XML data us...
- Question 4: You need to convert the functionality of Legacy.sql to use a...
- Question 5: You have a table named Table1. Table1 has 1 million rows. Ta...
- Question 6: Your company has a SQL Azure subscription. You implement a d...
- Question 7: You have a database for a mission-critical web application. ...
- Question 8: You have a SQL Server 2012 database named database1. Users r...
- Question 9: You have a database that contains a user-defined function na...
- Question 10: You have a database hosted on SQL Azure. You are developing ...
- Question 11: You have a database named Database1. Database1 has two store...
- Question 12: You need to add a new column named Confirmed to the Employee...
- Question 13: You use SQL Azure to store data used by an e-commerce applic...
- Question 14: You need to identify which long running transactions use an ...
- Question 15: You execute IndexManagement.sql and you receive the followin...
- Question 16: You have a table named Customers that has a clustered index ...
- Question 17: You are planning two stored procedures named SProc1 and SPro...
- Question 18: You have a database that uses the following management views...
- Question 19: An administrator provides a digital certificate named Server...
- Question 20: You have a Microsoft SQL Azure database. You have the follow...
- Question 21: You are testing disaster recovery procedures. You attempt to...
- Question 22: You need to implement a solution that addresses the performa...
- Question 23: You need to implement a solution that meets the locking requ...
- Question 24: You need to provide referential integrity between the Office...
- Question 25: You need to identify the cause of the page split issues. Whi...
- Question 26: You have a database named database1. Database developers rep...
- Question 27: You need to implement a solution that meets the job applicat...
- Question 28: You need to recommend a solution to ensure that SQL1 support...
- Question 29: You plan to execute the following code: (Exhibit) You need t...
- Question 30: You need to prepare the database to use the .NET Framework P...
- Question 31: You execute IndexManagement.sql and you receive the followin...
- Question 32: You need to design the UserActivity table. Which three steps...
- Question 33: You need to ensure that a new execution plan is used by usp_...
- Question 34: You execute the following code: (Exhibit) You need to select...
- Question 35: You need to implement security for the restore and audit pro...
- Question 36: You need to modify usp_SelectEmployeesByName to support serv...
- Question 37: You need to modify the stored procedure usp_LookupConcurrent...
- Question 38: You discover that the usp_GetOrdersAndItems stored procedure...
- Question 39: You need to implement a solution that addresses the index mo...
- Question 40: You need to recommend a solution that meets the concurrency ...
- Question 41: You need to implement a solution that resolves the salary qu...
- Question 42: You are creating a table named Orders. You need to ensure th...
- Question 43: You need to modify InsertInvoice to comply with the applicat...
- Question 44: You need to design a solution that meets the refactoring req...
- Question 45: Which data type should you use for CustomerID?...
- Question 46: You need to modify the usp_DetectSuspiciousActivity stored p...
- Question 47: You need to create the InvoiceStatus table in DB1. How shoul...
- Question 48: You need to redesign the system to meet the scalability requ...
- Question 49: You need to create a script that automates the export of the...
- Question 50: You attempt to process an invoice by using usp_InsertInvoice...
- Question 51: You need to modify the stored procedure usp_LookupConcurrent...
- Question 52: You have a database that contains a table named Department. ...
- Question 53: You need to recommend a solution to ensure that SQL1 support...
- Question 54: You plan to create a custom aggregation function named Funct...
- Question 55: You plan to create a stored procedure that inserts data from...
- Question 56: You need to implement a solution that meets the security req...
- Question 57: You are testing disaster recovery procedures. When you attem...
- Question 58: You execute the following code: (Exhibit) You create a noncl...
- Question 59: You need to resolve the performance issues of the usp_Export...
- Question 60: You need to implement a solution that meets the data recover...
- Question 61: You need to add a new column named Confirmed to the Attendee...
- Question 62: You need to ensure that a new execution plan is used by usp_...
- Question 63: While testing the CategoryFromType function, you discover th...
- Question 64: You need to create the object used by the parameter of usp_I...
- Question 65: You have an index for a table in a SQL Azure database. The d...
- Question 66: You plan to design an application that temporarily stores da...
- Question 67: You have a table named Table1 that contains 1 million rows. ...
- Question 68: You need to modify usp_GetOrdersAndItems to ensure that an o...
- Question 69: Which code segment should you use to define the ProductDetai...
- Question 70: You need to create a function that will use a SELECT stateme...
- Question 71: You execute the following code: (Exhibit) The execution plan...
- Question 72: You discover that usp.SelectSpeakersByName executes slowly i...
- Question 73: You need to create the object used by the parameter of usp_U...
- Question 74: You run the following code segment: (Exhibit) After you add ...
- Question 75: You need to implement a solution that meets the site require...
- Question 76: You execute usp_SelectEmployeesByName multiple times, passin...
- Question 77: You need to modify usp.GetOrdersAndItems to ensure that an o...
- Question 78: You create a table named Customers by using the following co...
- Question 79: Developers report that usp_UpdateSessionRoom periodically re...
- Question 80: You execute usp_TestSpeakers. You discover that usp_SelectSp...
- Question 81: You use SQL Server 2012 to maintain the data used by the app...
- Question 82: You need to provide referential integrity between the Sessio...
- Question 83: You need to modify usp_SelectSpeakersByName to support serve...
- Question 84: You need to ensure that if any of the statements in usp_Upda...
- Question 85: You need to ensure that usp_AddXMLOrder can be used to valid...
- Question 86: You need to implement a solution that meets the data recover...
- Question 87: You are evaluating the table design. You need to recommend a...
- Question 88: You need to implement a solution that addresses the upload r...
- Question 89: You need to implement a solution that solves the performance...
- Question 90: You need to implement a new version of usp_AddMobileLocation...
- Question 91: You need to create the usp.AssignUser stored procedure. Deve...
- Question 92: You are planning the ManufacturingSteps table. You need to d...
- Question 93: You have an application that uses a view to access data from...
- Question 94: You run the following code: (Exhibit) You need to ensure tha...
- Question 95: You need to implement a solution that addresses the page spl...
- Question 96: You need to implement a change to usp_ExportOpenings that me...
- Question 97: You review a query that runs slowly. The query accesses data...
- Question 98: You have a SQL Server 2012 database named Database1. Databas...
- Question 99: You are creating a table to support an application that will...
- Question 100: You need to optimize the index and table structures for POST...
- Question 101: You need to modify the function in CountryFromID.sql to ensu...
- Question 102: You execute the following code: (Exhibit) You have a stored ...
- Question 103: You need to build a stored procedure that amortizes the invo...
- Question 104: You need to optimize the index structure that is used by the...
- Question 105: You need to modify Production.ProductDetails_Insert to compl...
- Question 106: You need to implement a solution that addresses the bulk ins...
- Question 107: You are evaluating the index design for the database. You ha...
- Question 108: You need to monitor the health of your tables and indexes in...
- Question 109: You plan to create a database that has multiple tables. The ...
- Question 110: You need to create a function that filters invoices by Custo...
