- Home
- NAHQ
- Certified Professional in Healthcare Quality Examination
- NAHQ.CPHQ.v2025-06-16.q185
- Question 183
Valid CPHQ Dumps shared by ExamDiscuss.com for Helping Passing CPHQ Exam! ExamDiscuss.com now offer the newest CPHQ exam dumps, the ExamDiscuss.com CPHQ exam questions have been updated and answers have been corrected get the newest ExamDiscuss.com CPHQ dumps with Test Engine here:
Access CPHQ Dumps Premium Version
(635 Q&As Dumps, 35%OFF Special Discount Code: freecram)
<< Prev Question Next Question >>
Question 183/185
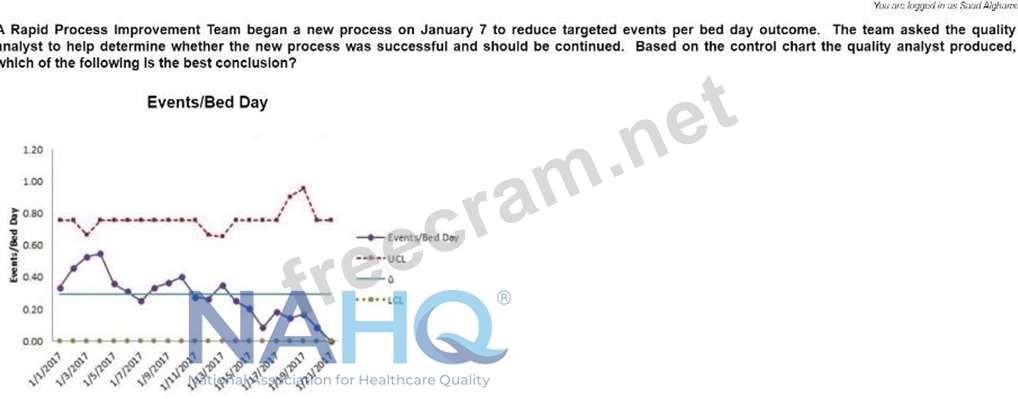
A Rapid Process Improvement Team began a new process on January 7 to reduce targeted events per bed day outcome. The team asked the quality analyst to help determine whether the new process was successful and should be continued. Based on the control chart the quality analyst produced, which of the following is the best conclusion?
Correct Answer: B
* Reviewing the Control Chart DataThe control chart shows "Events/Bed Day" over time, with the Upper Control Limit (UCL), Lower Control Limit (LCL), and a center line (CL) marking the baseline average of the process before the intervention.
* Identifying the Impact of the New Process
* The intervention to reduce events per bed day was implemented on January 7.
* Following this date, there is a noticeable and consistent decrease in the number of events per bed day, with data points gradually moving downward.
* Eventually, the values settle well below the original center line, indicating a decreasing shift in the process.
* Differentiating Between Trends and Shifts
* A shift is characterized by a sustained change in process level, often due to a successful intervention, as seen here with lower event rates maintained over time.
* In this case, the shift is in a favorable direction, as the targeted events per bed day have reduced significantly and consistently.
* A trend would indicate a continuous movement in a direction, but this chart shows that after an initial decline, the process stabilizes at a lower rate.
* ConclusionSince the process has demonstrated a decreasing shift, indicating improvement and reduced events per bed day, the correct recommendation is to continue the process, as it appears successful in achieving the goal.
References:
* NAHQ "Statistical Process Control and Process Improvement Strategies"
* "Evaluating Shifts and Trends in Control Charts for Quality Improvement" (NAHQ, 2021)


- Question List (185q)
- Question 1: A physician group with a patient population of 10,000 during...
- Question 2: Which of the following strategies promotes timely completion...
- Question 3: Before patient outcome data can be used for benchmarking, th...
- Question 4: A recent journal article has identified three new patient sa...
- Question 5: A healthcare quality professional Is doing a study in the em...
- Question 6: Accountability for quality ultimately rests with the...
- Question 7: An internal customer of the admission process in a skilled n...
- Question 8: When working with a new quality Improvement team, the qualit...
- Question 9: The chairperson of the governing body has requested an annua...
- Question 10: An organization's preventable fall goal is not to exceed gre...
- Question 11: A researcher decides to look at every fourth patient admitte...
- Question 12: Which of the following is the quality professional's first s...
- Question 13: A hospital is considering changing the process of admissions...
- Question 14: To best achieve a low rate of harm in spite of inherent risk...
- Question 15: Which of the following tools should be used to determine the...
- Question 16: Which of the following is the best example of a non-value ad...
- Question 17: What Is the Initial step the quality professional should tak...
- Question 18: An organization that demonstrates a culture of safety...
- Question 19: Education sessions were held to improve bar code medication ...
- Question 20: Leadership at a facility reviewed and revised business proce...
- Question 21: Leadership at an outpatient multi-specialty clinic Is workin...
- Question 22: Four surgical centers formed a collaboration to reduce post-...
- Question 23: Which of the following Is an example of a population health ...
- Question 24: A healthcare quality professional receives the following Con...
- Question 25: A pulmonologist is gathering social determinants of health d...
- Question 26: A physician's profile shows a 4% readmission rate following ...
- Question 27: A recent Journal article has Identified three new patient sa...
- Question 28: Technology design that prevents a certain action, or require...
- Question 29: An organization Is shirting paradigms from top-down leadersh...
- Question 30: A multidisciplinary team has been convened to review delays ...
- Question 31: Which of the following is the most effective method to ident...
- Question 32: To best achieve a low rale of harm In spite of Inherent risk...
- Question 33: When allocating limited resources to meet strategic objectiv...
- Question 34: Which of the following would provide the best information to...
- Question 35: A healthcare organization has recently launched a diabetes c...
- Question 36: Which of the following presents a set of high-level measures...
- Question 37: A skilled nursing facility has implemented a process to addr...
- Question 38: A healthcare quality professional's initial step in the crea...
- Question 39: Based on this matrix, which of the following ideas should th...
- Question 40: Which of the following Is an algorithm that Is designed to c...
- Question 41: A patient safety manager is asked to recommend the best acti...
- Question 42: Using the Information below, which patient population Is at ...
- Question 43: A CEO and chief nursing officer have requested a new quality...
- Question 44: Which of the following statements most accurately describes ...
- Question 45: To effectively communicate performance indicator results, in...
- Question 46: A focused professional practice evaluation (FPPE) Is Initiat...
- Question 47: A healthcare organization has been providing cardiac care to...
- Question 48: A new pediatric psychiatric unit will open in one year. The ...
- Question 49: Which of the following Is true of a clinical pathway?...
- Question 50: Through routine collection of incident reports, an increase ...
- Question 51: Choosing a small number of items to represent characteristic...
- Question 52: Which of the following approaches best allows an agency to a...
- Question 53: A nursing unit has collected the following data: (Exhibit) W...
- Question 54: Which of the following tools would be used to outline factor...
- Question 55: The median is defined as the
- Question 56: Which of the following Is an example of active surveillance?...
- Question 57: An interdisciplinary learn met to review readmission rates a...
- Question 58: A healthcare quality professional has been asked to assess a...
- Question 59: One of the first steps in preparing for an organizational ac...
- Question 60: Which of the following best describes the goal of the Health...
- Question 61: A criterion is considered valid if it...
- Question 62: A home healthcare organization is looking to identify third-...
- Question 63: A goal of measurement is to collect valid and reliable data ...
- Question 64: Which of the following best describes the goal of the Health...
- Question 65: A performance improvement coordinator is having difficulty k...
- Question 66: A goal of measurement is to collect valid and reliable data ...
- Question 67: The best means of reducing sentinel events In a care deliver...
- Question 68: A quality professional has been asked to assist with priorit...
- Question 69: The most important determinant of quality improvement succes...
- Question 70: Which of the following are the three primary quality managem...
- Question 71: Which of the following would be the best methodology to redu...
- Question 72: An organization has Implemented a quality improvement projec...
- Question 73: A long-term care facility has experienced an Increase in occ...
- Question 74: Prior to a regulatory or accreditation visit, a healthcare q...
- Question 75: Which of the following tools would best display nosocomial i...
- Question 76: The focus for performance Improvement should be...
- Question 77: A hospital is using the above chart to monitor the average l...
- Question 78: Which of the following is an effective method to motivate em...
- Question 79: An organization has Just experienced a wrong site surgery. A...
- Question 80: An ambulatory pulmonary division is in the final phase of a ...
- Question 81: Which of the following tools will best help a quality profes...
- Question 82: There is an increased incidence of type 2 diabetes among pat...
- Question 83: Which of the following is an example of a social determinant...
- Question 84: When recommending a quality improvement project, the quality...
- Question 85: A nursing home has established a quality indicator to accomp...
- Question 86: In aligning an organization's performance Improvement plan w...
- Question 87: A patient safety program can best be enhanced by which of th...
- Question 88: Accountable care organizations (ACOs) utilize "hot spotting"...
- Question 89: Which of the following is the best example of population hea...
- Question 90: The quality manager needs to identify a set of process measu...
- Question 91: A healthcare quality professional has the following data on ...
- Question 92: When prioritizing quality improvement initiatives, which of ...
- Question 93: An increased number of outpatient surgery patients present t...
- Question 94: A health system in an underserved area seeks to improve medi...
- Question 95: A healthcare quality professional Is facilitating the establ...
- Question 96: A root cause analysis (RCA) was conducted for an event relat...
- Question 97: In reviewing information offered by the Agency for Healthcar...
- Question 98: A rapid cycle improvement team has met for six months. The t...
- Question 99: When an identified solution requires significant change, the...
- Question 100: The trend of a variable over time is best illustrated by a:...
- Question 101: A continuous survey readiness program requires which of the ...
- Question 102: The health department cited a clinic for storing used instru...
- Question 103: Which of the following is the best approach to motivate stak...
- Question 104: A Pareto chart can be used to
- Question 105: While the use of technology may result in fewer medical erro...
- Question 106: Why is it important to convene a multidisciplinary team when...
- Question 107: A performance improvement team was formed to reduce the inap...
- Question 108: In an improvement project to improve clinic flow, a spaghett...
- Question 109: An organization recently completed an analysis of safety eve...
- Question 110: A quality improvement coordinator is asked to develop a trai...
- Question 111: Which of the following tools aids decision-making through or...
- Question 112: Which of the following actions will best promote organizatio...
- Question 113: During a risk assessment, It Is noted that a unit manager an...
- Question 114: The purpose of sentinel event review of never events is to...
- Question 115: A hospital's quality professional notices a high 30-day read...
- Question 116: Which of the following should the team do next? (Exhibit)...
- Question 117: Each department in a hospital self-monitors and reports hand...
- Question 118: A long-term care facility Is Interested in analyzing data to...
- Question 119: A 300-bed healthcare organization has decided to apply for a...
- Question 120: Which of the following is an example of an alternative payme...
- Question 121: Which of the following actions will most effectively promote...
- Question 122: A team has completed several tests of change and has arrived...
- Question 123: A new pediatric psychiatric unit will open in one year. The ...
- Question 124: A key concept in patient safety planning is to design proced...
- Question 125: A managed care peer review committee should obtain which of ...
- Question 126: Evaluating data to determine high utilizers of emergency dep...
- Question 127: A performance improvement council has been directed to set u...
- Question 128: Which of the following should be used to show beginning and ...
- Question 129: Which of the following is one purpose of clinical pathways?...
- Question 130: An ambulatory care practice has reviewed data to identify pa...
- Question 131: A patient safety manager provided training on hand hygiene g...
- Question 132: Which of the following most accurately describes medication ...
- Question 133: Annual evaluation of a quality Improvement process must...
- Question 134: Each department in a hospital self-monitors and reports hand...
- Question 135: The main goal of a clinical pathway/guideline Is lo...
- Question 136: Which of the following represents a medically underserved po...
- Question 137: Which of the following infection prevention techniques repre...
- Question 138: A hospital Is anticipating an accreditation survey In the ne...
- Question 139: An initial step to address health disparities within a popul...
- Question 140: X quality professional is reviewing medication adherence dat...
- Question 141: To determine how much variability in a process Is due to ran...
- Question 142: Which of the following is the role a healthcare quality prof...
- Question 143: When developing objectives for an educational program, the q...
- Question 144: Which of the following is the best method of determining imp...
- Question 145: The following data are known: (Exhibit) Which of the followi...
- Question 146: A healthcare system has multiple medical clinics across a la...
- Question 147: A local health center is launching a community health assess...
- Question 148: Which of the following best describes the purpose of the nom...
- Question 149: In addition to being a good communicator, an essential chara...
- Question 150: A quality professional was asked to assist with strategic pl...
- Question 151: Which of the following quality Improvement Tools Is best for...
- Question 152: Which of the following best describes how a quality professi...
- Question 153: The healthcare quality professional has been asked to partic...
- Question 154: An improvement project was implemented to expand utilization...
- Question 155: The expectation to maintain continuous survey readiness must...
- Question 156: Which of the following is an example of a structural measure...
- Question 157: Which of the following is the best strategy to increase a co...
- Question 158: The quality professional has been asked to perform chart aud...
- Question 159: A quality professional Is the leader of a team in the stormi...
- Question 160: The safety reporting system being used by an organization ca...
- Question 161: Which of the following stages may cause continuous quality i...
- Question 162: An orthopedic surgery practice has been working on improving...
- Question 163: A healthcare organization has been providing cardiac care to...
- Question 164: What tool displays performance outside of expected values to...
- Question 165: An organization has implemented a quality improvement projec...
- Question 166: A health system successfully recruited patients to participa...
- Question 167: Which of the following is the most effective means of commun...
- Question 168: A performance improvement team is looking at data from simil...
- Question 169: A sentinel event is a situation that reaches the patient and...
- Question 170: Which of the following is the best strategy for executive le...
- Question 171: Prior to implementing a new patient service, the healthcare ...
- Question 172: A healthcare quality professional wants to find out whether ...
- Question 173: Which of the following is the most effective way to promote ...
- Question 174: Multi-voting Is frequently used in which of the following st...
- Question 175: Which management accountability action should be Implemented...
- Question 176: A recent analysis reveals that reimbursement projection Is b...
- Question 177: A continuous quality improvement team has proposed a major c...
- Question 178: Based on the chart below, implementing which of the followin...
- Question 179: A quality improvement team has been trained on writing SMART...
- Question 180: An organization has a goal to increase profitability of serv...
- Question 181: An effective meeting requires which of the following?...
- Question 182: Over the past 2 months, a trend has been detected in medicat...
- Question 183: A Rapid Process Improvement Team began a new process on Janu...
- Question 184: Managed care outcomes related to HEDIS measures are most com...
- Question 185: The office manager of a primary care office reviewed the per...
